| 2025-12-02 09:05:00+08:00 |
57 |
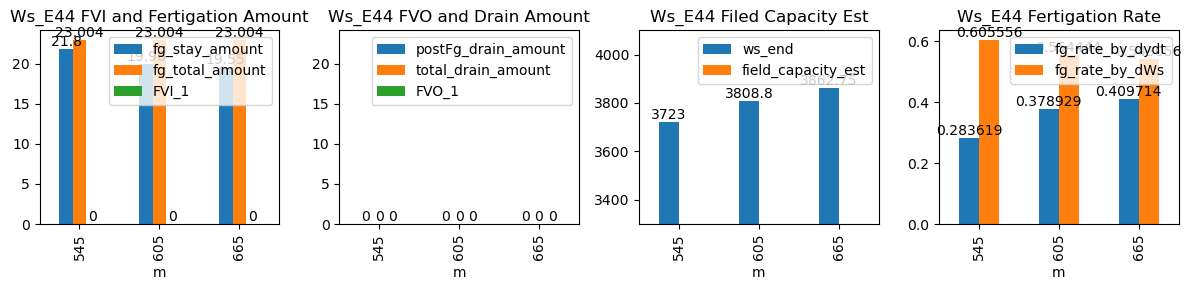
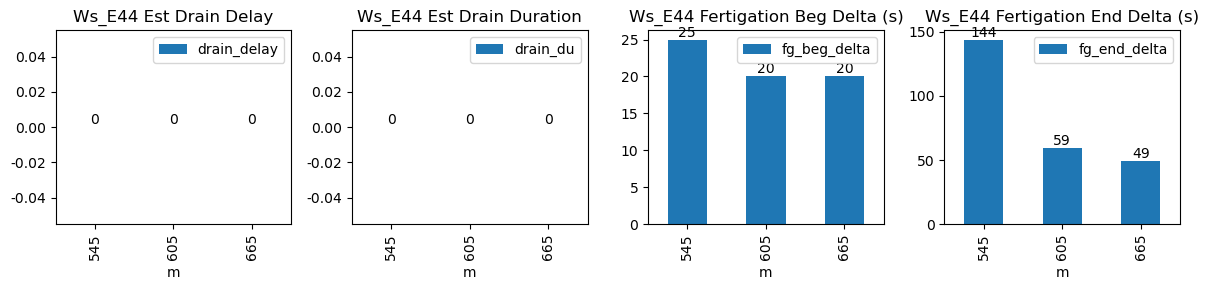
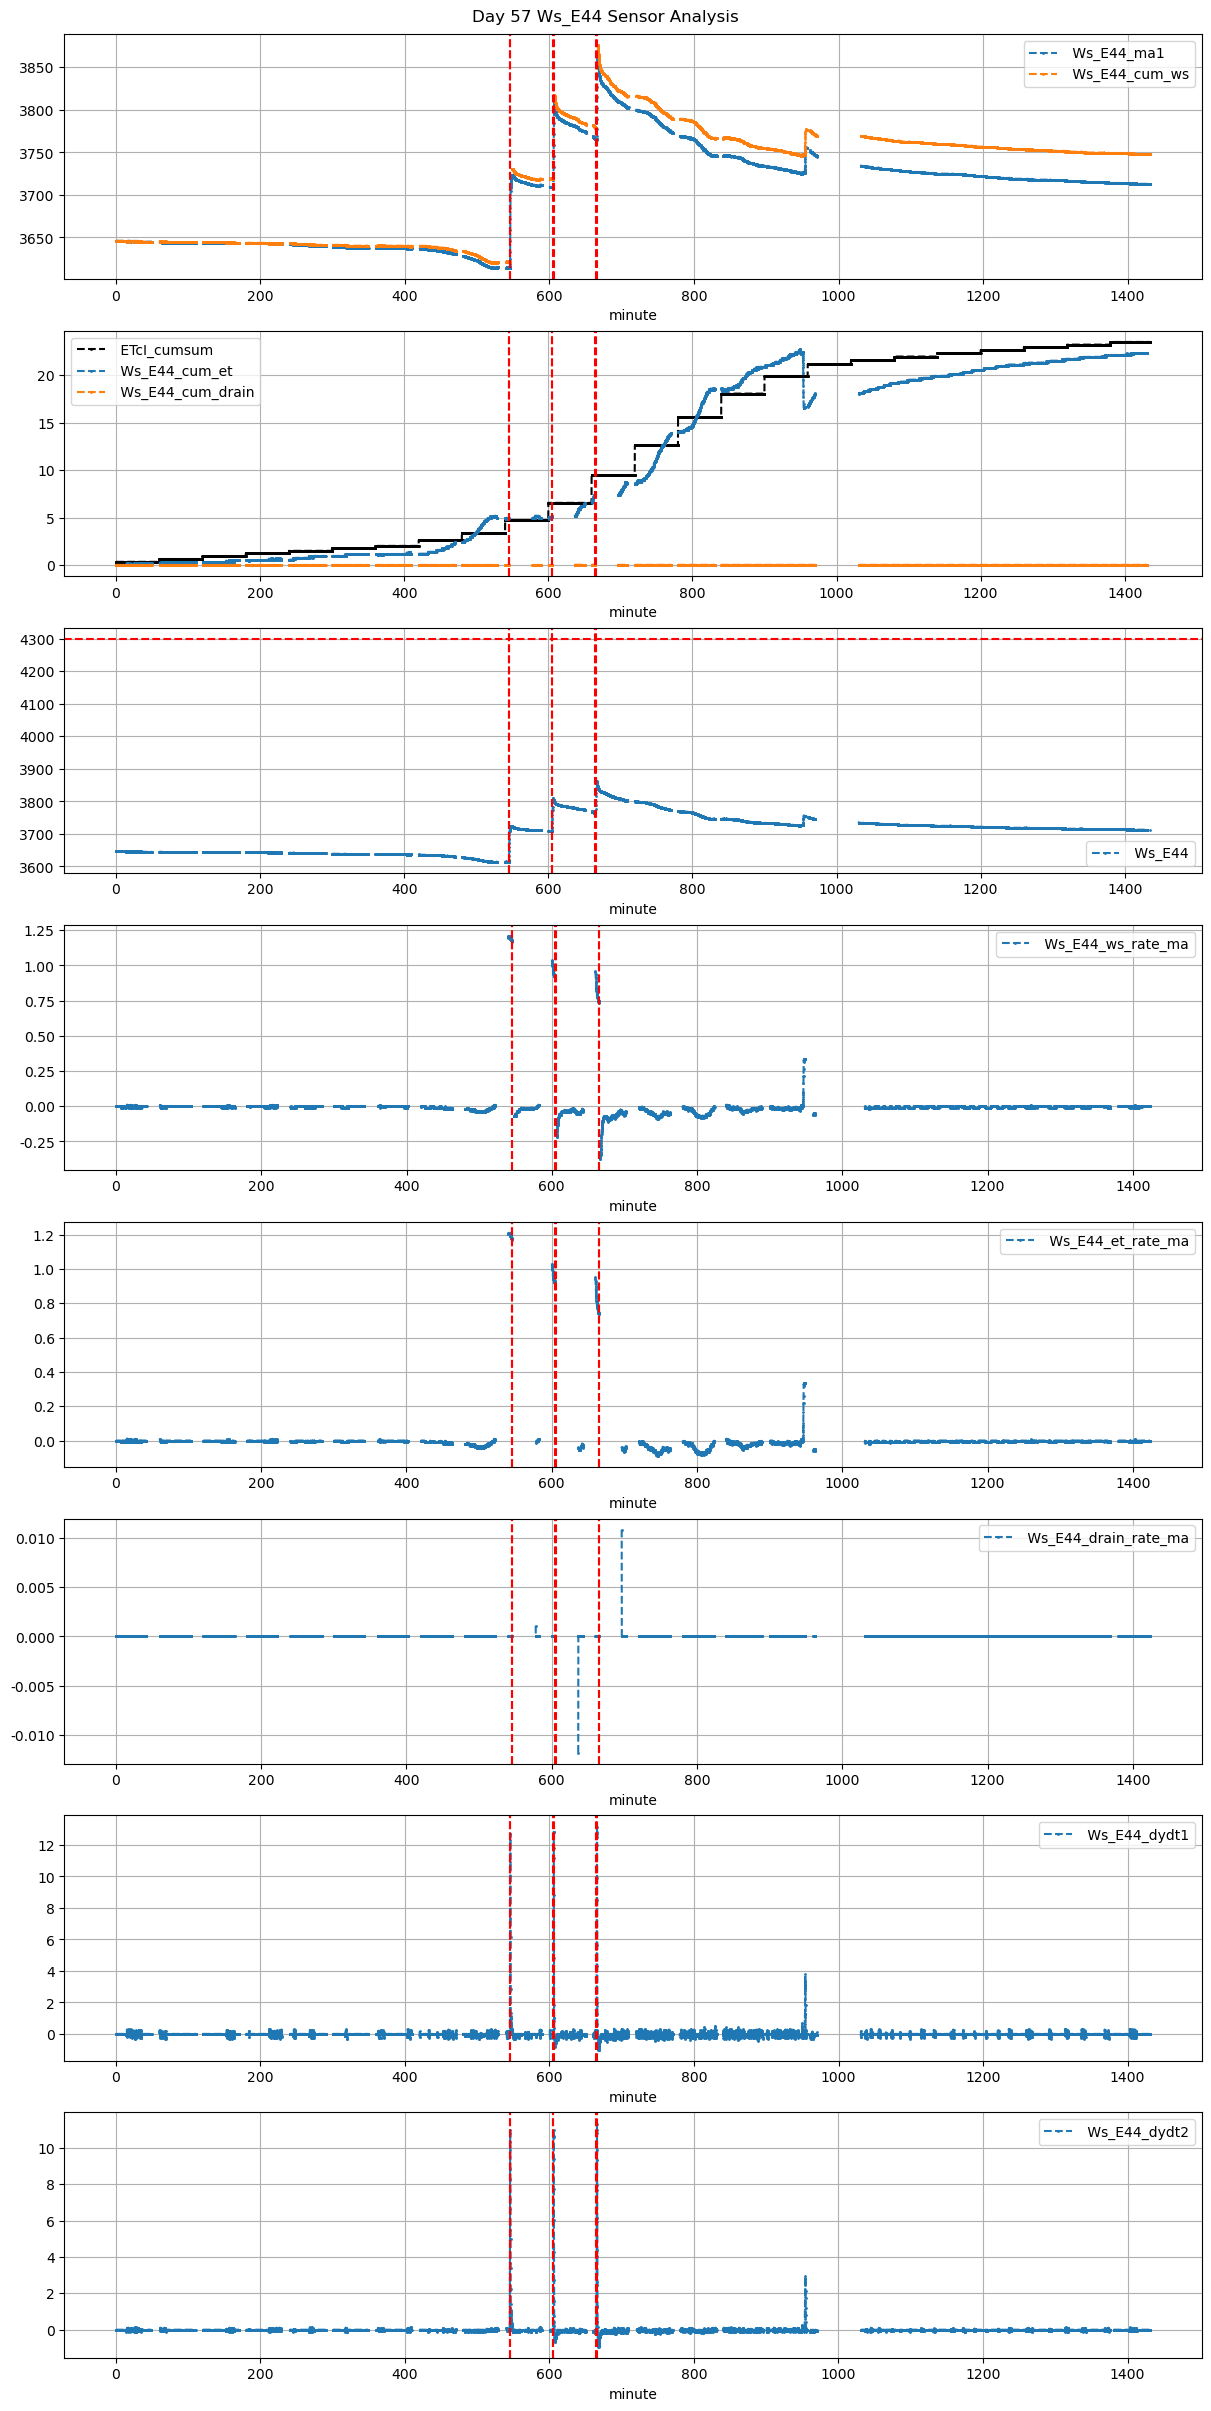
545 |
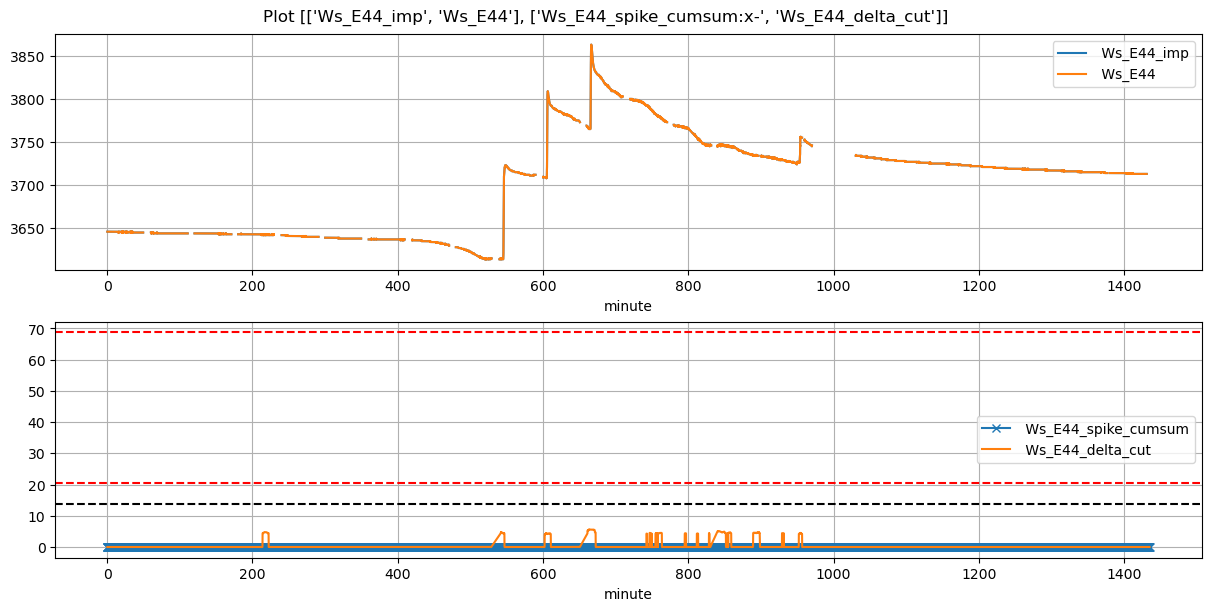
Ws_E44 |
0.280277 |
30 |
545.0 |
545.416667 |
545.6 |
548.000000 |
3614.0 |
3723.00 |
36 |
NaN |
-0.046852 |
-0.012187 |
0.283619 |
0.605556 |
21.80 |
True |
25.0 |
144.0 |
23.004 |
0.0 |
0 |
0.0 |
NaN |
NaN |
NaN |
NaN |
NaN |
NaN |
| 2025-12-02 10:05:00+08:00 |
57 |
605 |
Ws_E44 |
0.280277 |
30 |
605.0 |
605.333333 |
605.6 |
606.583333 |
3709.0 |
3808.80 |
36 |
NaN |
-0.087643 |
-0.038210 |
0.378929 |
0.554444 |
19.96 |
True |
20.0 |
59.0 |
23.004 |
0.0 |
0 |
0.0 |
NaN |
NaN |
NaN |
NaN |
NaN |
NaN |
| 2025-12-02 11:05:00+08:00 |
57 |
665 |
Ws_E44 |
0.280277 |
30 |
665.0 |
665.333333 |
665.6 |
666.416667 |
3765.0 |
3862.75 |
36 |
NaN |
-0.156687 |
-0.046002 |
0.409714 |
0.543056 |
19.55 |
True |
20.0 |
49.0 |
23.004 |
0.0 |
0 |
0.0 |
NaN |
NaN |
NaN |
NaN |
NaN |
NaN |