| 2025-12-14 10:00:00+08:00 |
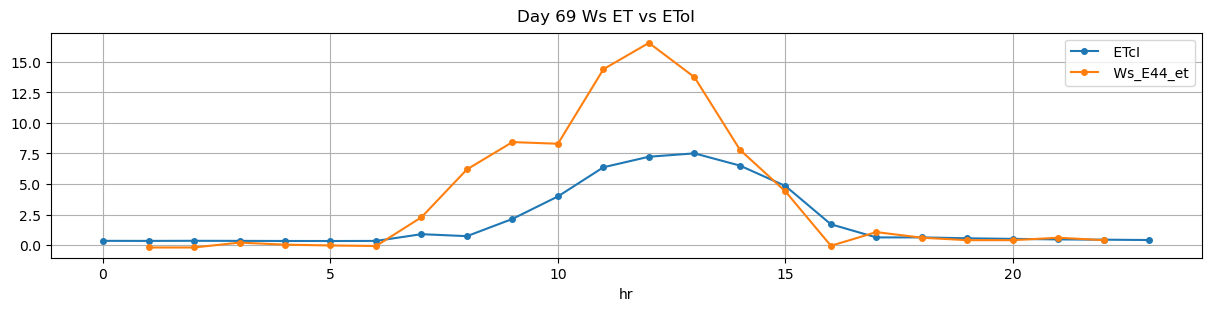
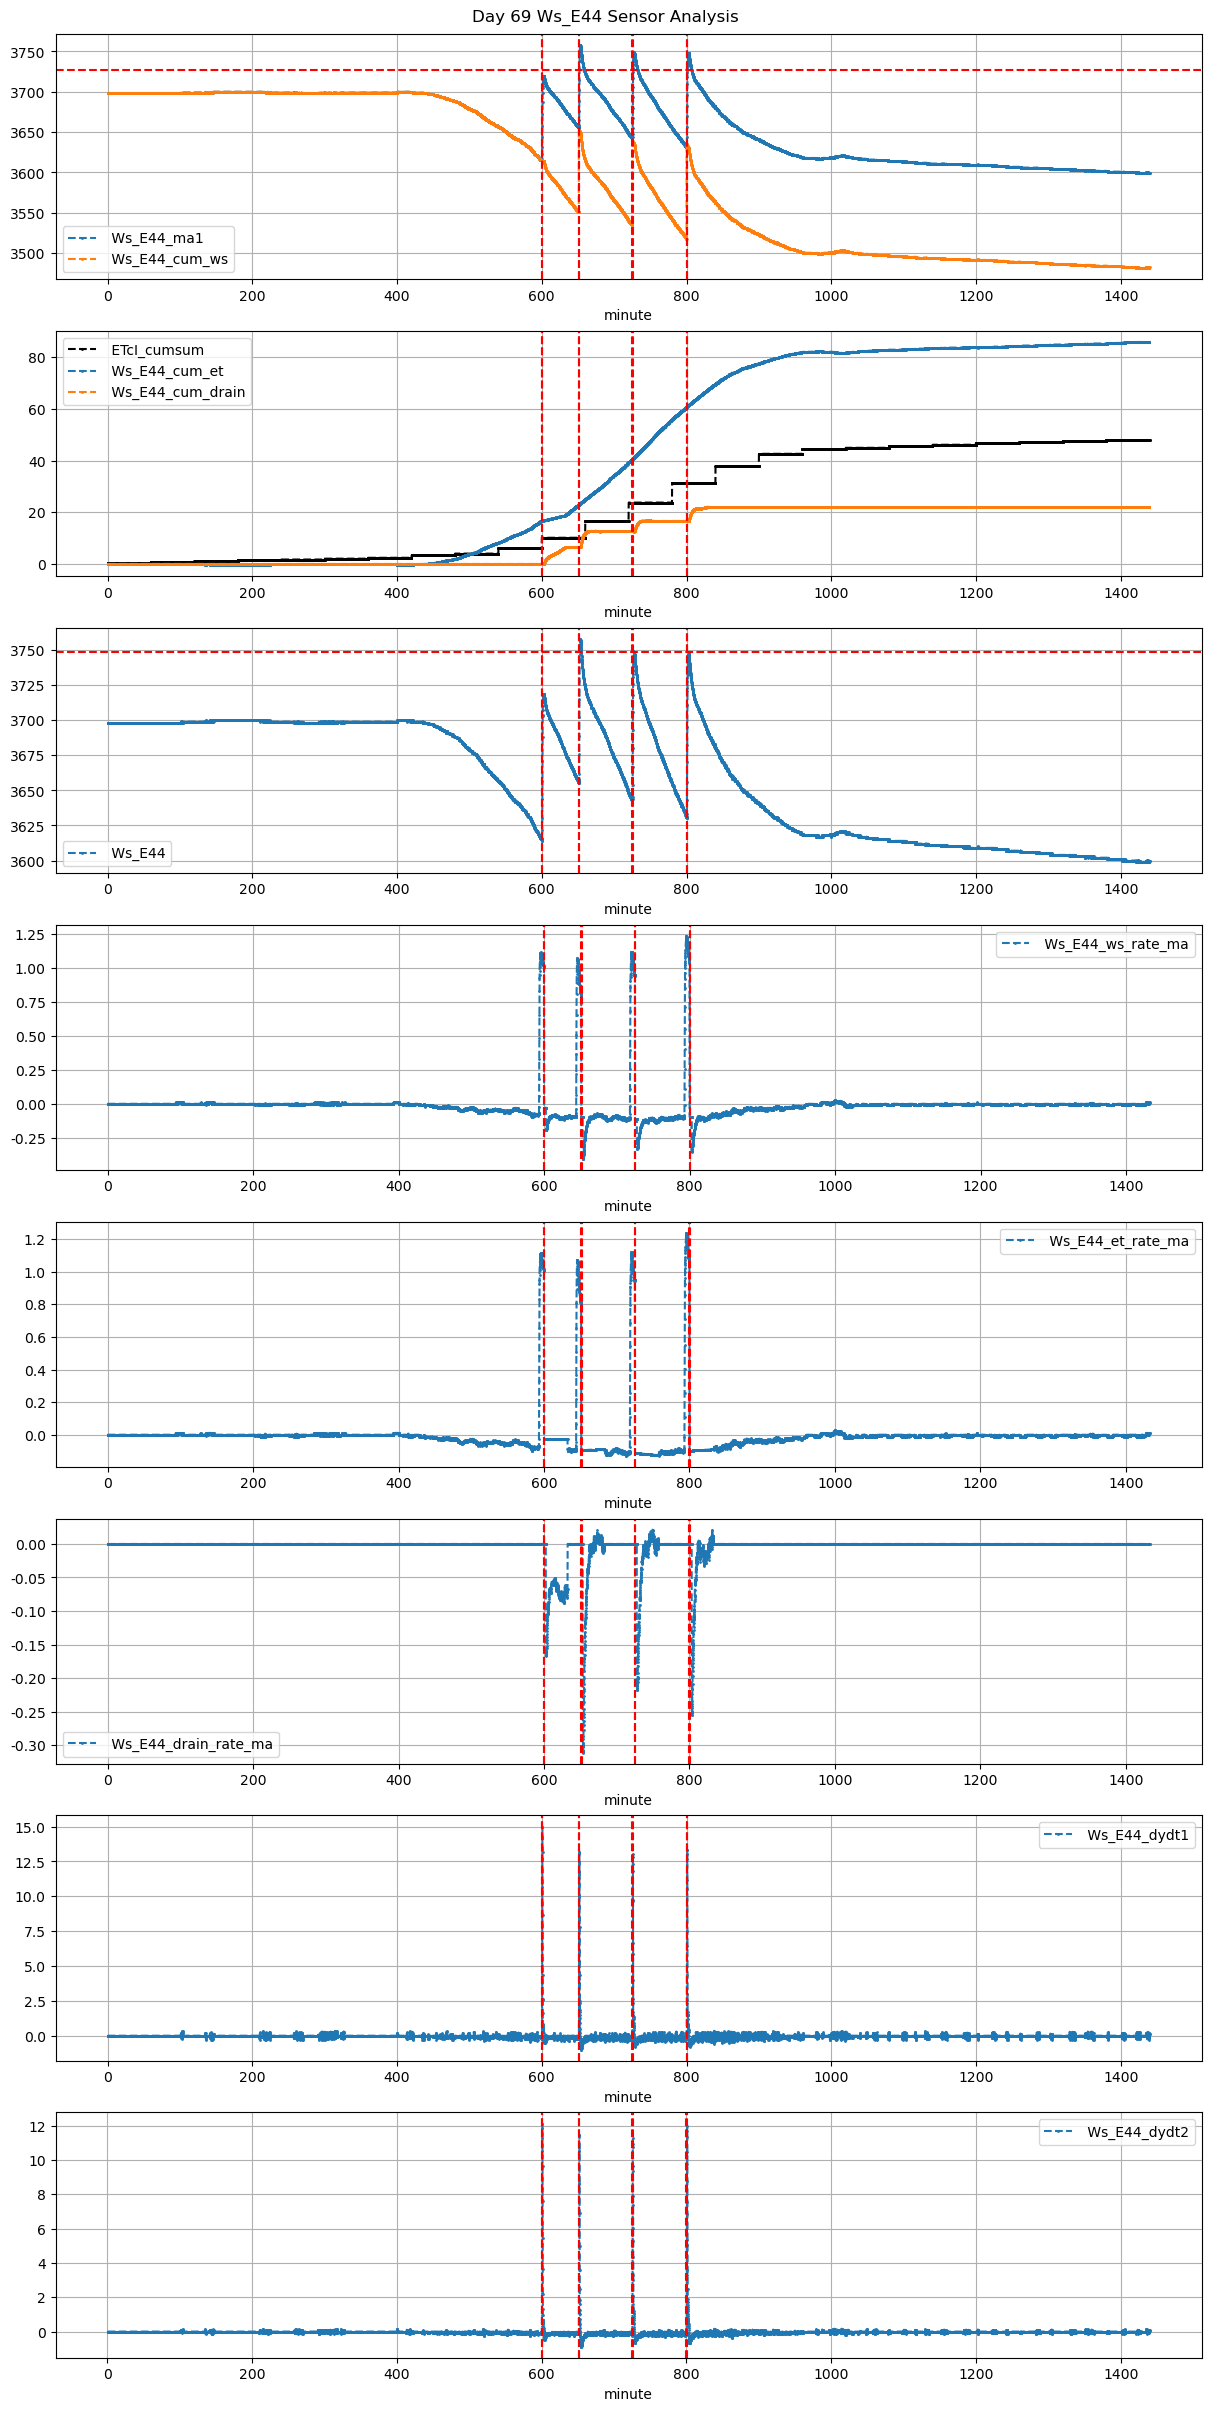
69 |
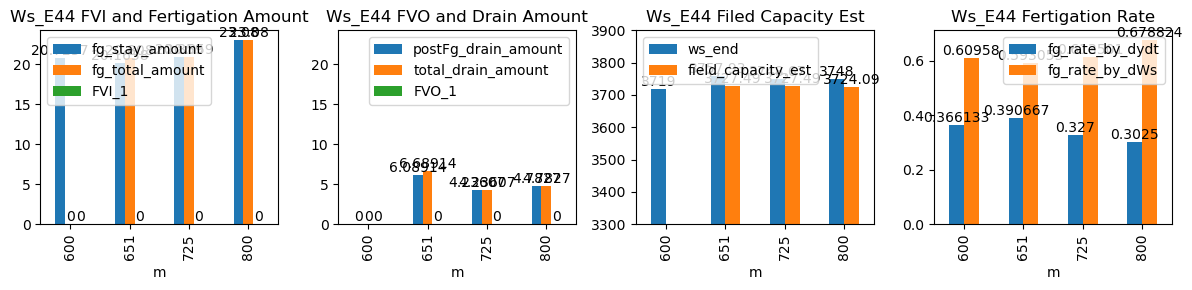
600 |
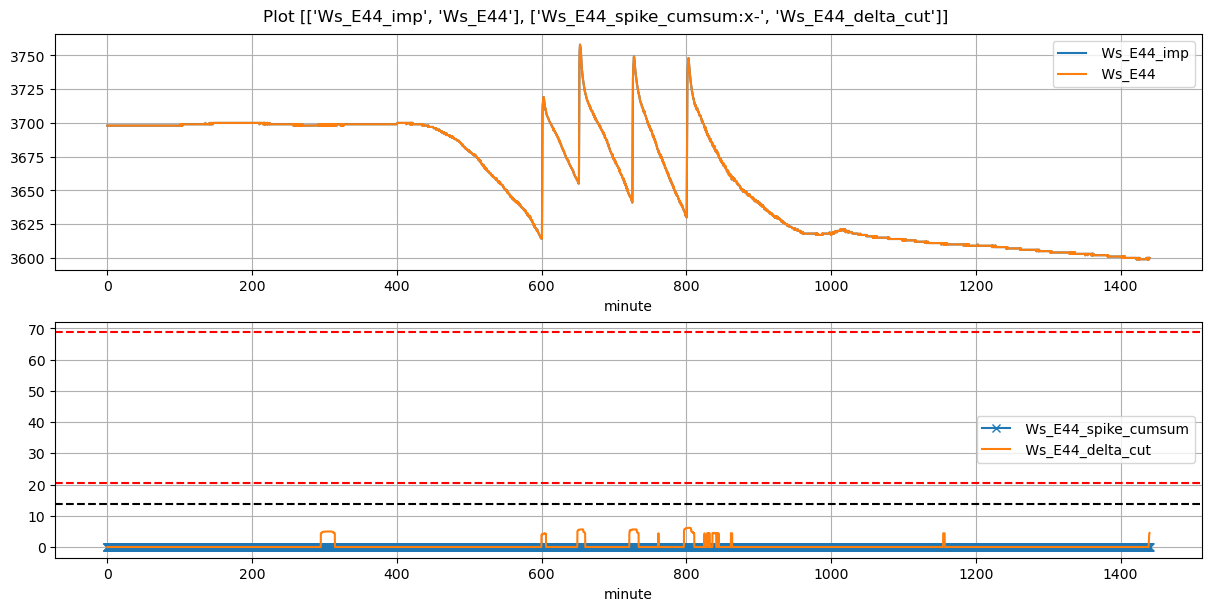
Ws_E44 |
0.380735 |
30 |
600.0 |
600.583333 |
600.57 |
602.416667 |
3615.371429 |
3719.000000 |
34 |
-0.027669 |
-0.125877 |
-0.027669 |
0.366133 |
0.609580 |
20.725714 |
False |
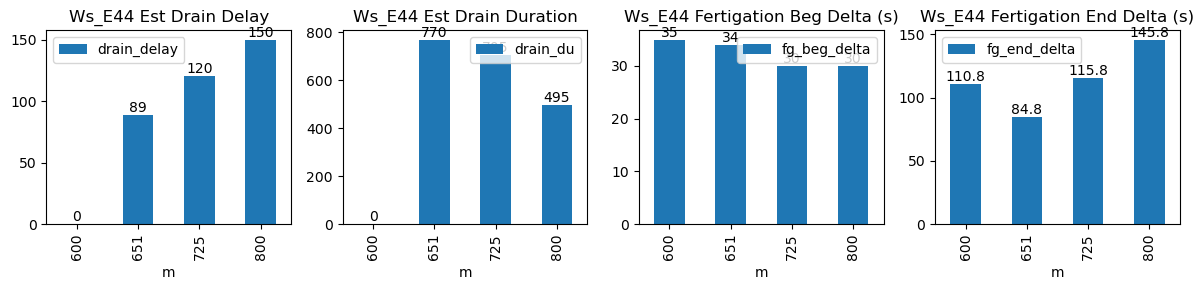
35.0 |
110.8 |
NaN |
NaN |
NaN |
NaN |
NaN |
NaN |
NaN |
NaN |
NaN |
NaN |
| 2025-12-14 10:51:06+08:00 |
69 |
651 |
Ws_E44 |
0.380735 |
30 |
651.1 |
651.666667 |
651.67 |
653.083333 |
3657.114286 |
3757.933333 |
34 |
-0.094722 |
-0.239630 |
-0.087963 |
0.390667 |
0.593053 |
20.163810 |
True |
34.0 |
84.8 |
20.808000 |
0.6 |
6.089137 |
6.689137 |
770.0 |
89.0 |
-0.298224 |
3727.487647 |
NaN |
NaN |
| 2025-12-14 12:05:00+08:00 |
69 |
725 |
Ws_E44 |
0.380735 |
30 |
725.0 |
725.500000 |
725.57 |
727.500000 |
3644.371429 |
3748.666667 |
34 |
-0.113196 |
-0.223313 |
-0.125817 |
0.327000 |
0.613501 |
20.859048 |
True |
30.0 |
115.8 |
20.859048 |
0.0 |
4.236070 |
4.236070 |
705.0 |
120.0 |
-0.205927 |
3727.486315 |
NaN |
NaN |
| 2025-12-14 13:20:00+08:00 |
69 |
800 |
Ws_E44 |
0.380735 |
30 |
800.0 |
800.500000 |
800.57 |
803.000000 |
3632.600000 |
3748.000000 |
34 |
-0.097200 |
-0.206020 |
-0.089683 |
0.302500 |
0.678824 |
23.080000 |
True |
30.0 |
145.8 |
23.080000 |
0.0 |
4.782705 |
4.782705 |
495.0 |
150.0 |
-0.192156 |
3724.086477 |
NaN |
NaN |