| 2025-12-12 09:10:00+08:00 |
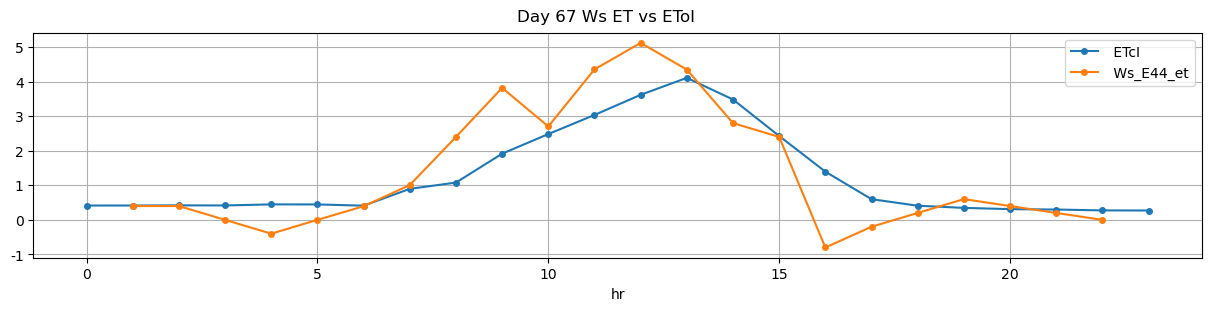
67 |
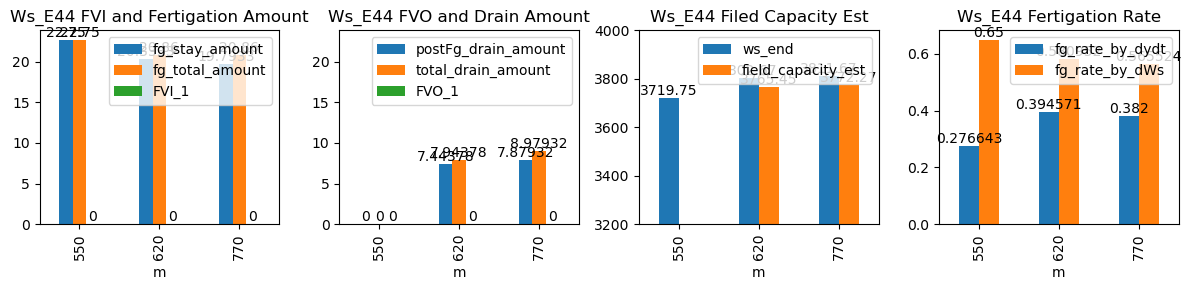
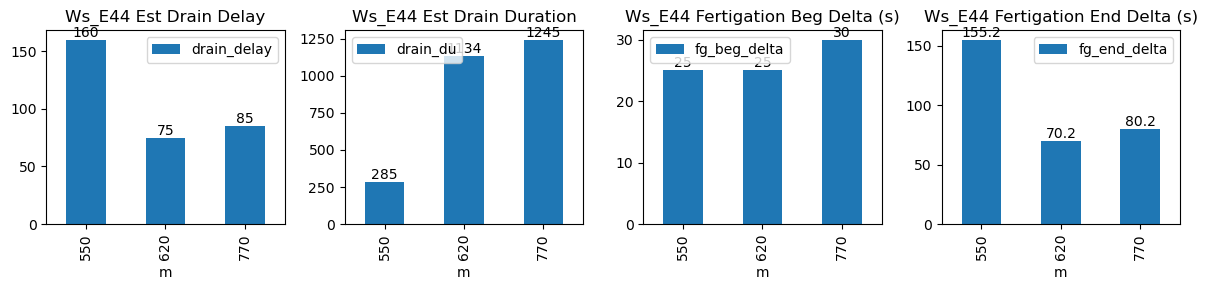
550 |
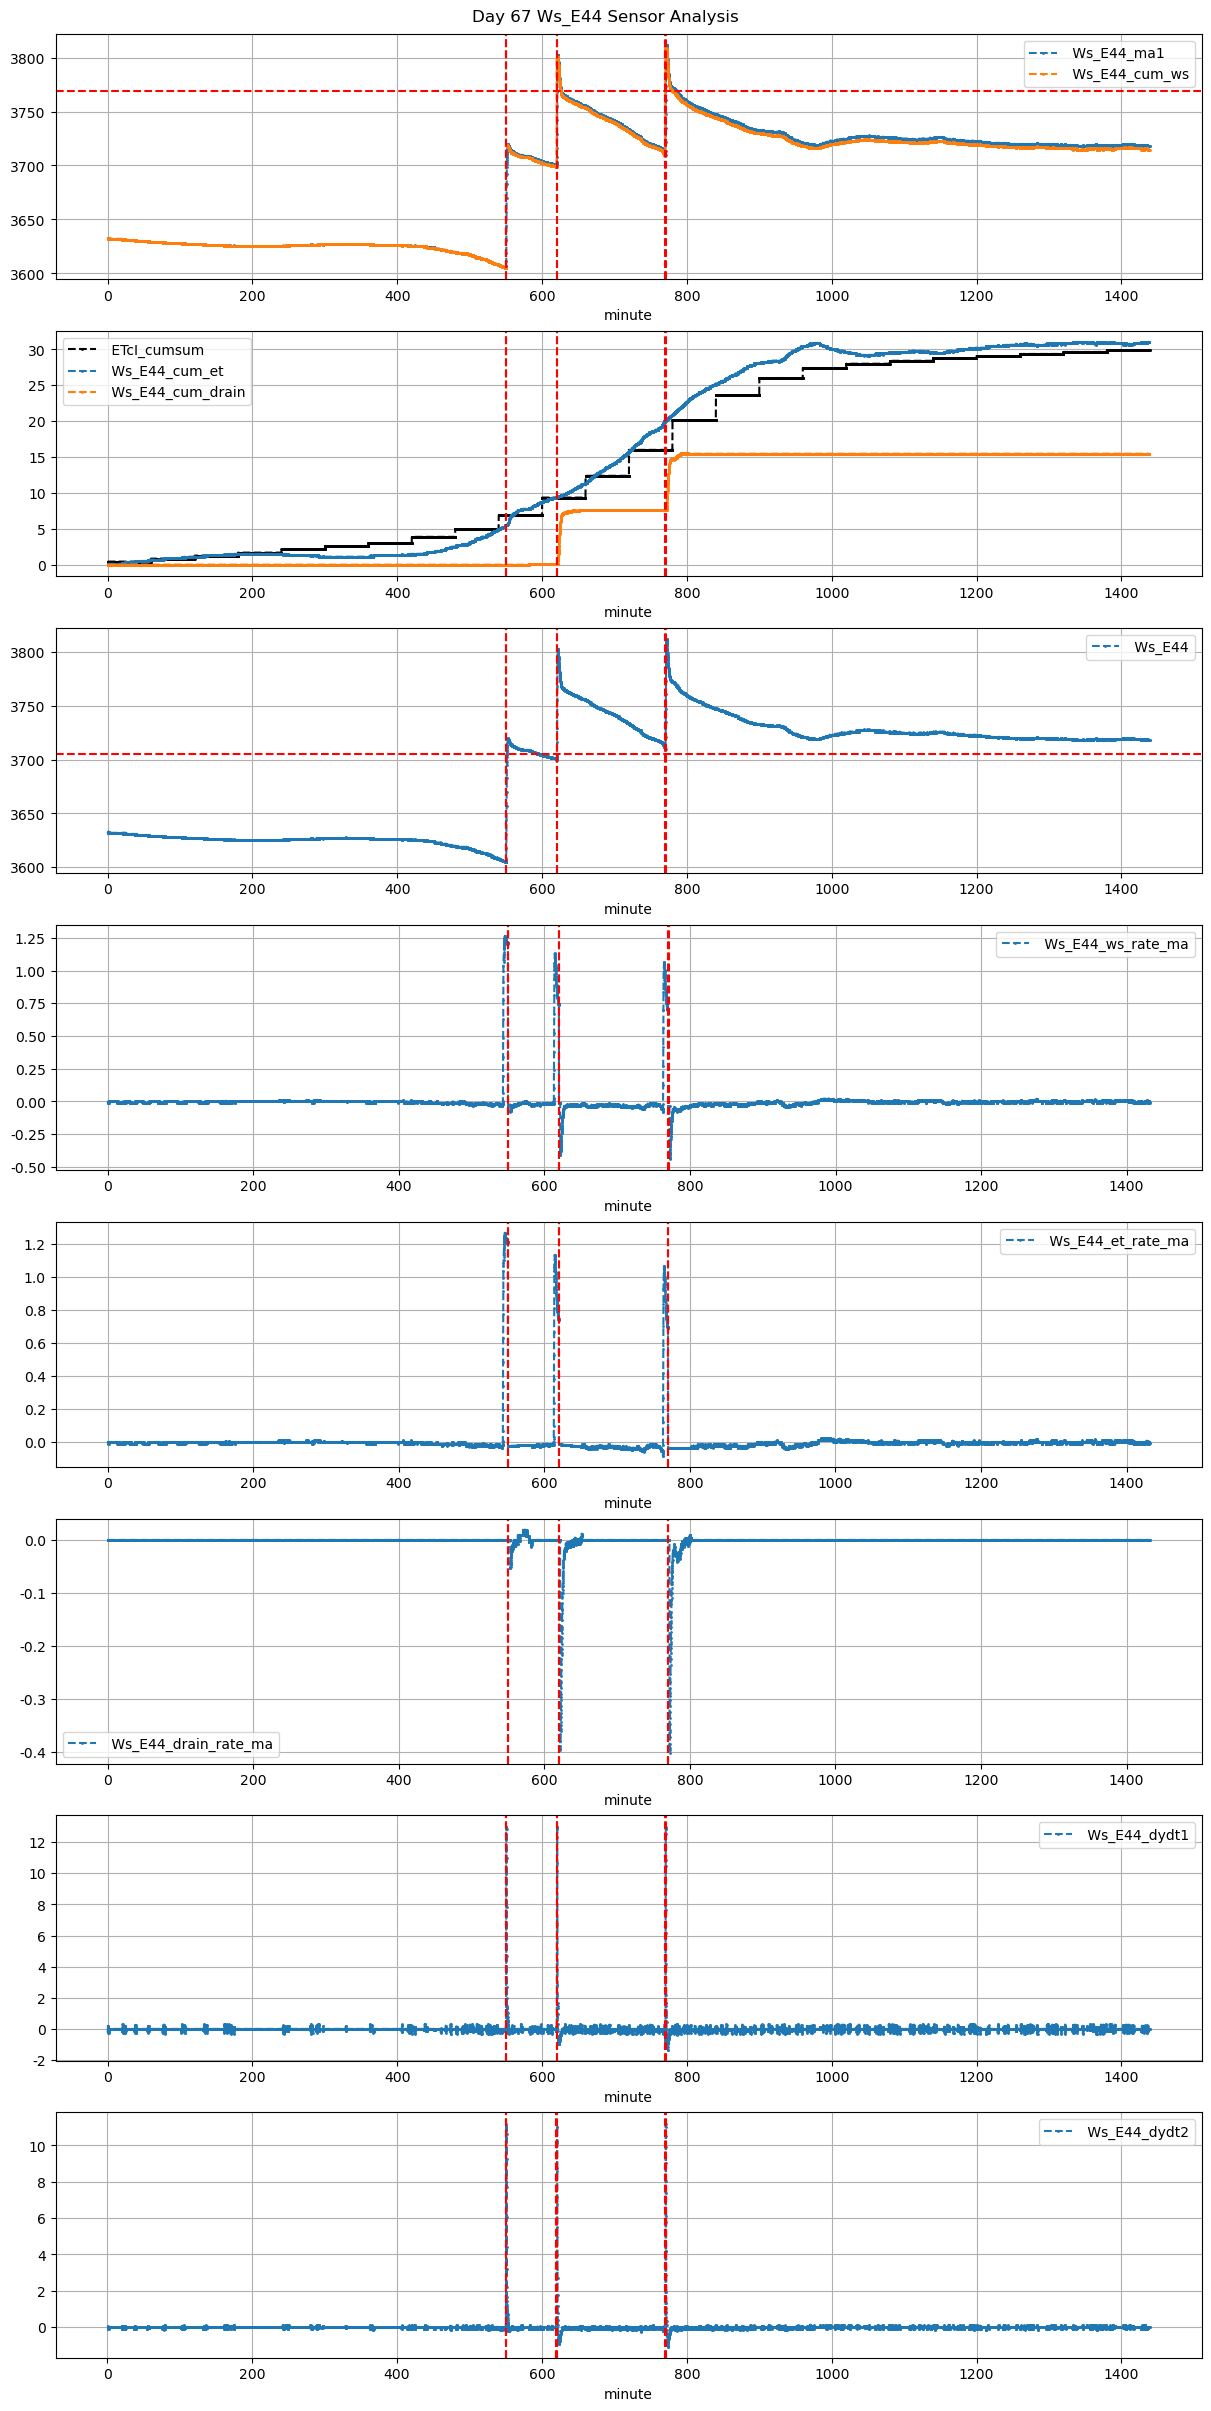
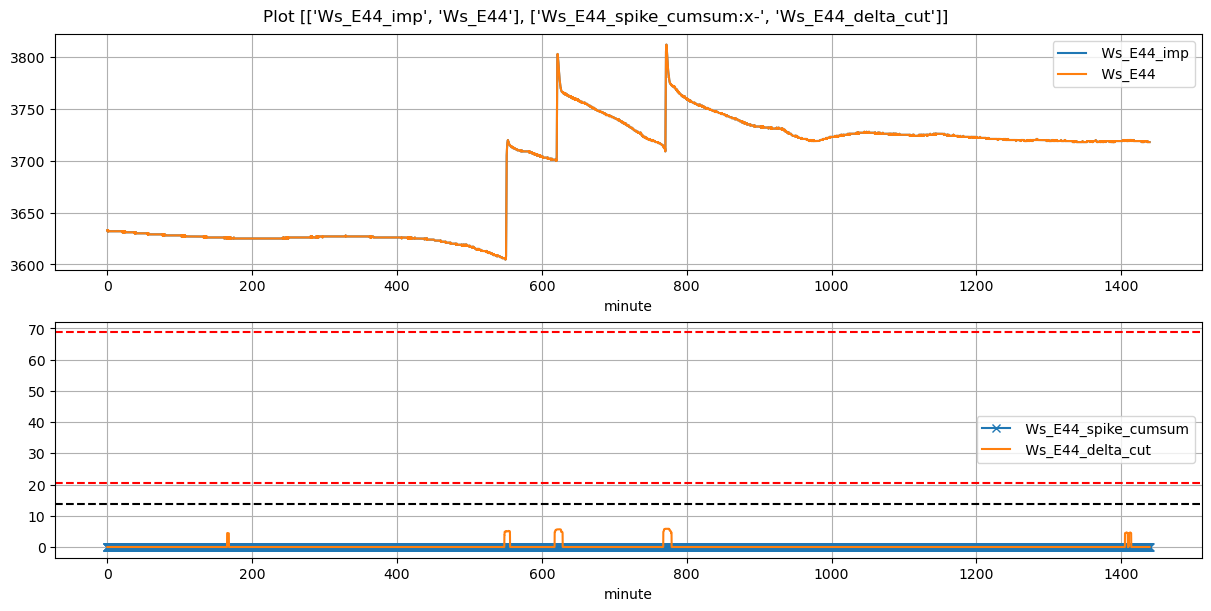
Ws_E44 |
0.320015 |
30 |
550.0 |
550.416667 |
550.58 |
553.166667 |
3606.0 |
3719.750000 |
35 |
-0.023346 |
-0.039938 |
-0.017299 |
0.276643 |
0.650000 |
22.750000 |
True |
25.0 |
155.2 |
22.75 |
0.0 |
0.000000 |
0.000000 |
285 |
160 |
-0.043483 |
NaN |
NaN |
NaN |
| 2025-12-12 10:20:00+08:00 |
67 |
620 |
Ws_E44 |
0.320015 |
30 |
620.0 |
620.416667 |
620.58 |
621.750000 |
3701.0 |
3802.666667 |
35 |
-0.014440 |
-0.147758 |
-0.028037 |
0.394571 |
0.580952 |
20.333333 |
True |
25.0 |
70.2 |
20.86 |
0.5 |
7.443776 |
7.943776 |
1134 |
75 |
-0.288279 |
3765.447789 |
NaN |
NaN |
| 2025-12-12 12:50:00+08:00 |
67 |
770 |
Ws_E44 |
0.320015 |
30 |
770.0 |
770.500000 |
770.58 |
771.916667 |
3712.7 |
3811.666667 |
35 |
-0.036392 |
-0.156704 |
-0.037407 |
0.382000 |
0.565524 |
19.793333 |
True |
30.0 |
80.2 |
20.86 |
1.1 |
7.879318 |
8.979318 |
1245 |
85 |
-0.268285 |
3772.270077 |
NaN |
NaN |