VI and VO Daily Summary
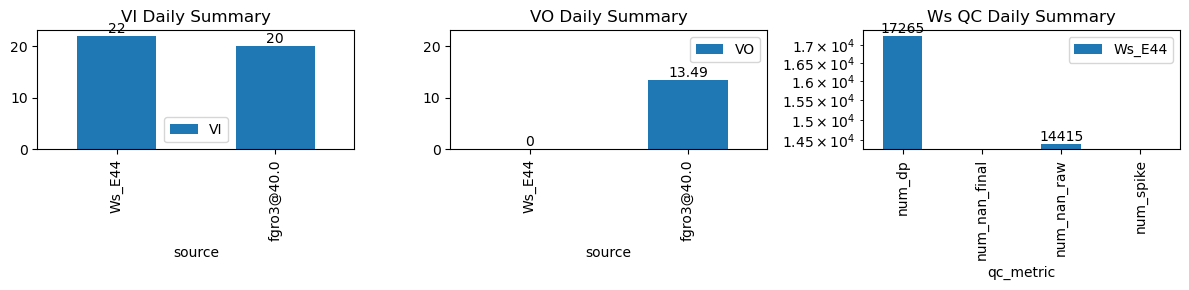
| ws_name | num_dp | num_nan_raw | num_nan_final | num_spike | cum_step_adj |
|---|---|---|---|---|---|
| Ws_E44 | 17,265 | 14,415 | 0 | 0 | 0.00 |
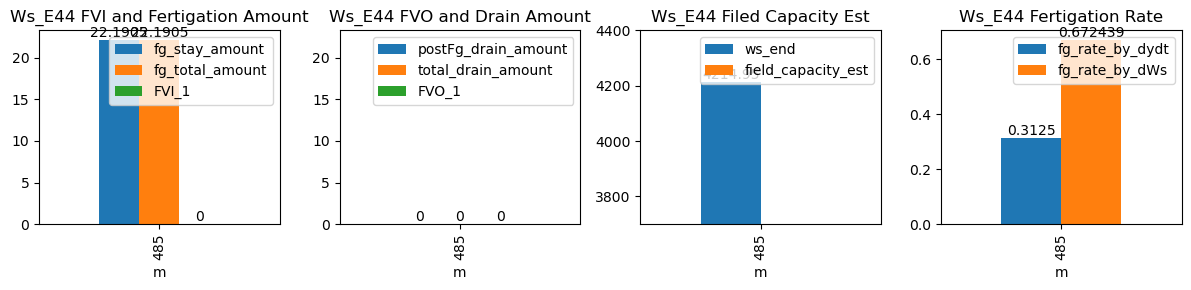
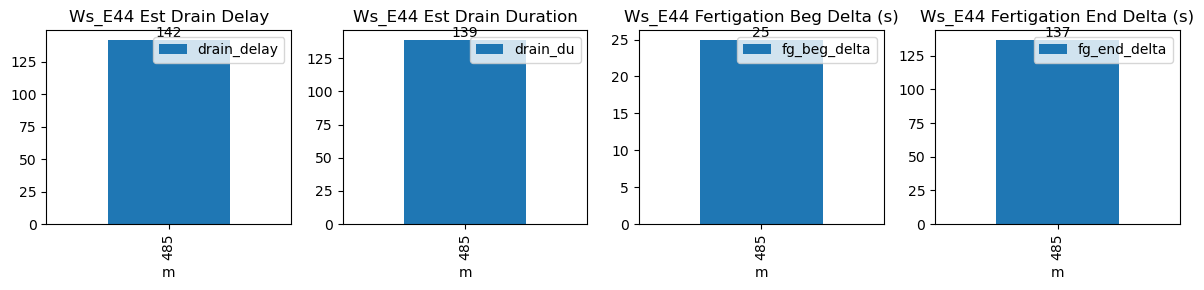
| ds | d | m | ws_name | prominence_cut | max_drain_du | fg_beg | fg_beg_est | fg_end | fg_end_est | ws_beg | ws_end | duc | pre_fg_et | post_fg_ws | post_drn_et | fg_rate_by_dydt | fg_rate_by_dWs | fg_stay_amount | enough_data | fg_beg_delta | fg_end_delta | fg_total_amount | fg_drain_amount | postFg_drain_amount | total_drain_amount | drain_du | drain_delay | drain_rate | field_capacity_est | FVI_1 | FVO_1 |
|---|---|---|---|---|---|---|---|---|---|---|---|---|---|---|---|---|---|---|---|---|---|---|---|---|---|---|---|---|---|---|---|
| 2026-01-19 08:05:00+08:00 | 105 | 485 | Ws_E44 | 0.156038 | 30 | 485.0 | 485.416667 | 485.55 | 487.833333 | 4104.0 | 4214.952381 | 33 | -0.000936 | 0.0 | 0.0 | 0.3125 | 0.672439 | 22.190476 | True | 25.0 | 137.0 | 22.190476 | 0.0 | 0 | 0.0 | 139 | 142 | -0.027778 | NaN | NaN | NaN |