VI and VO Daily Summary
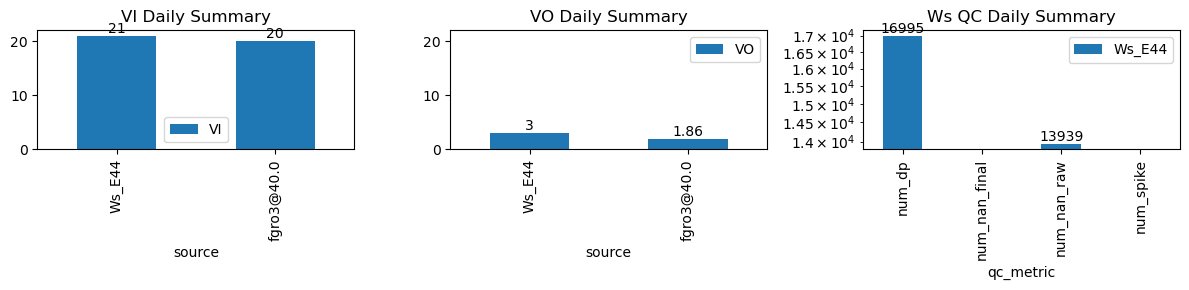
| ws_name | num_dp | num_nan_raw | num_nan_final | num_spike | cum_step_adj |
|---|---|---|---|---|---|
| Ws_E44 | 16,995 | 13,939 | 0 | 0 | 0.00 |
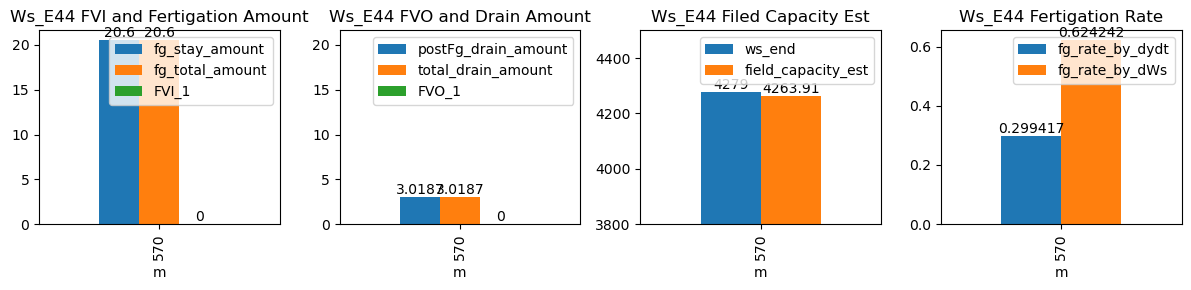
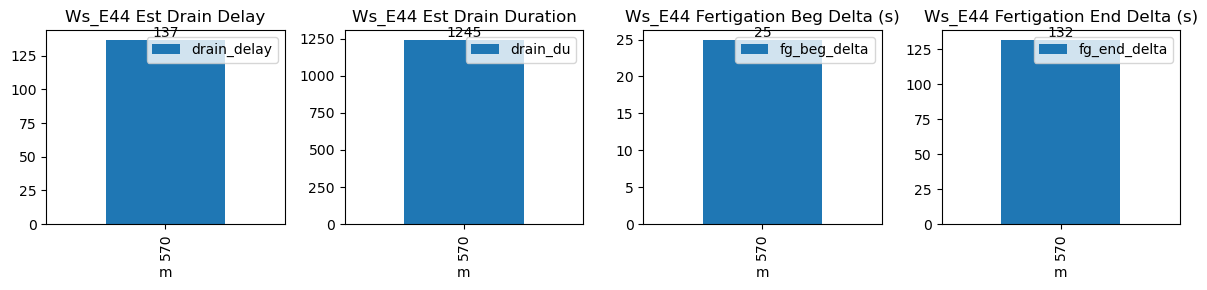
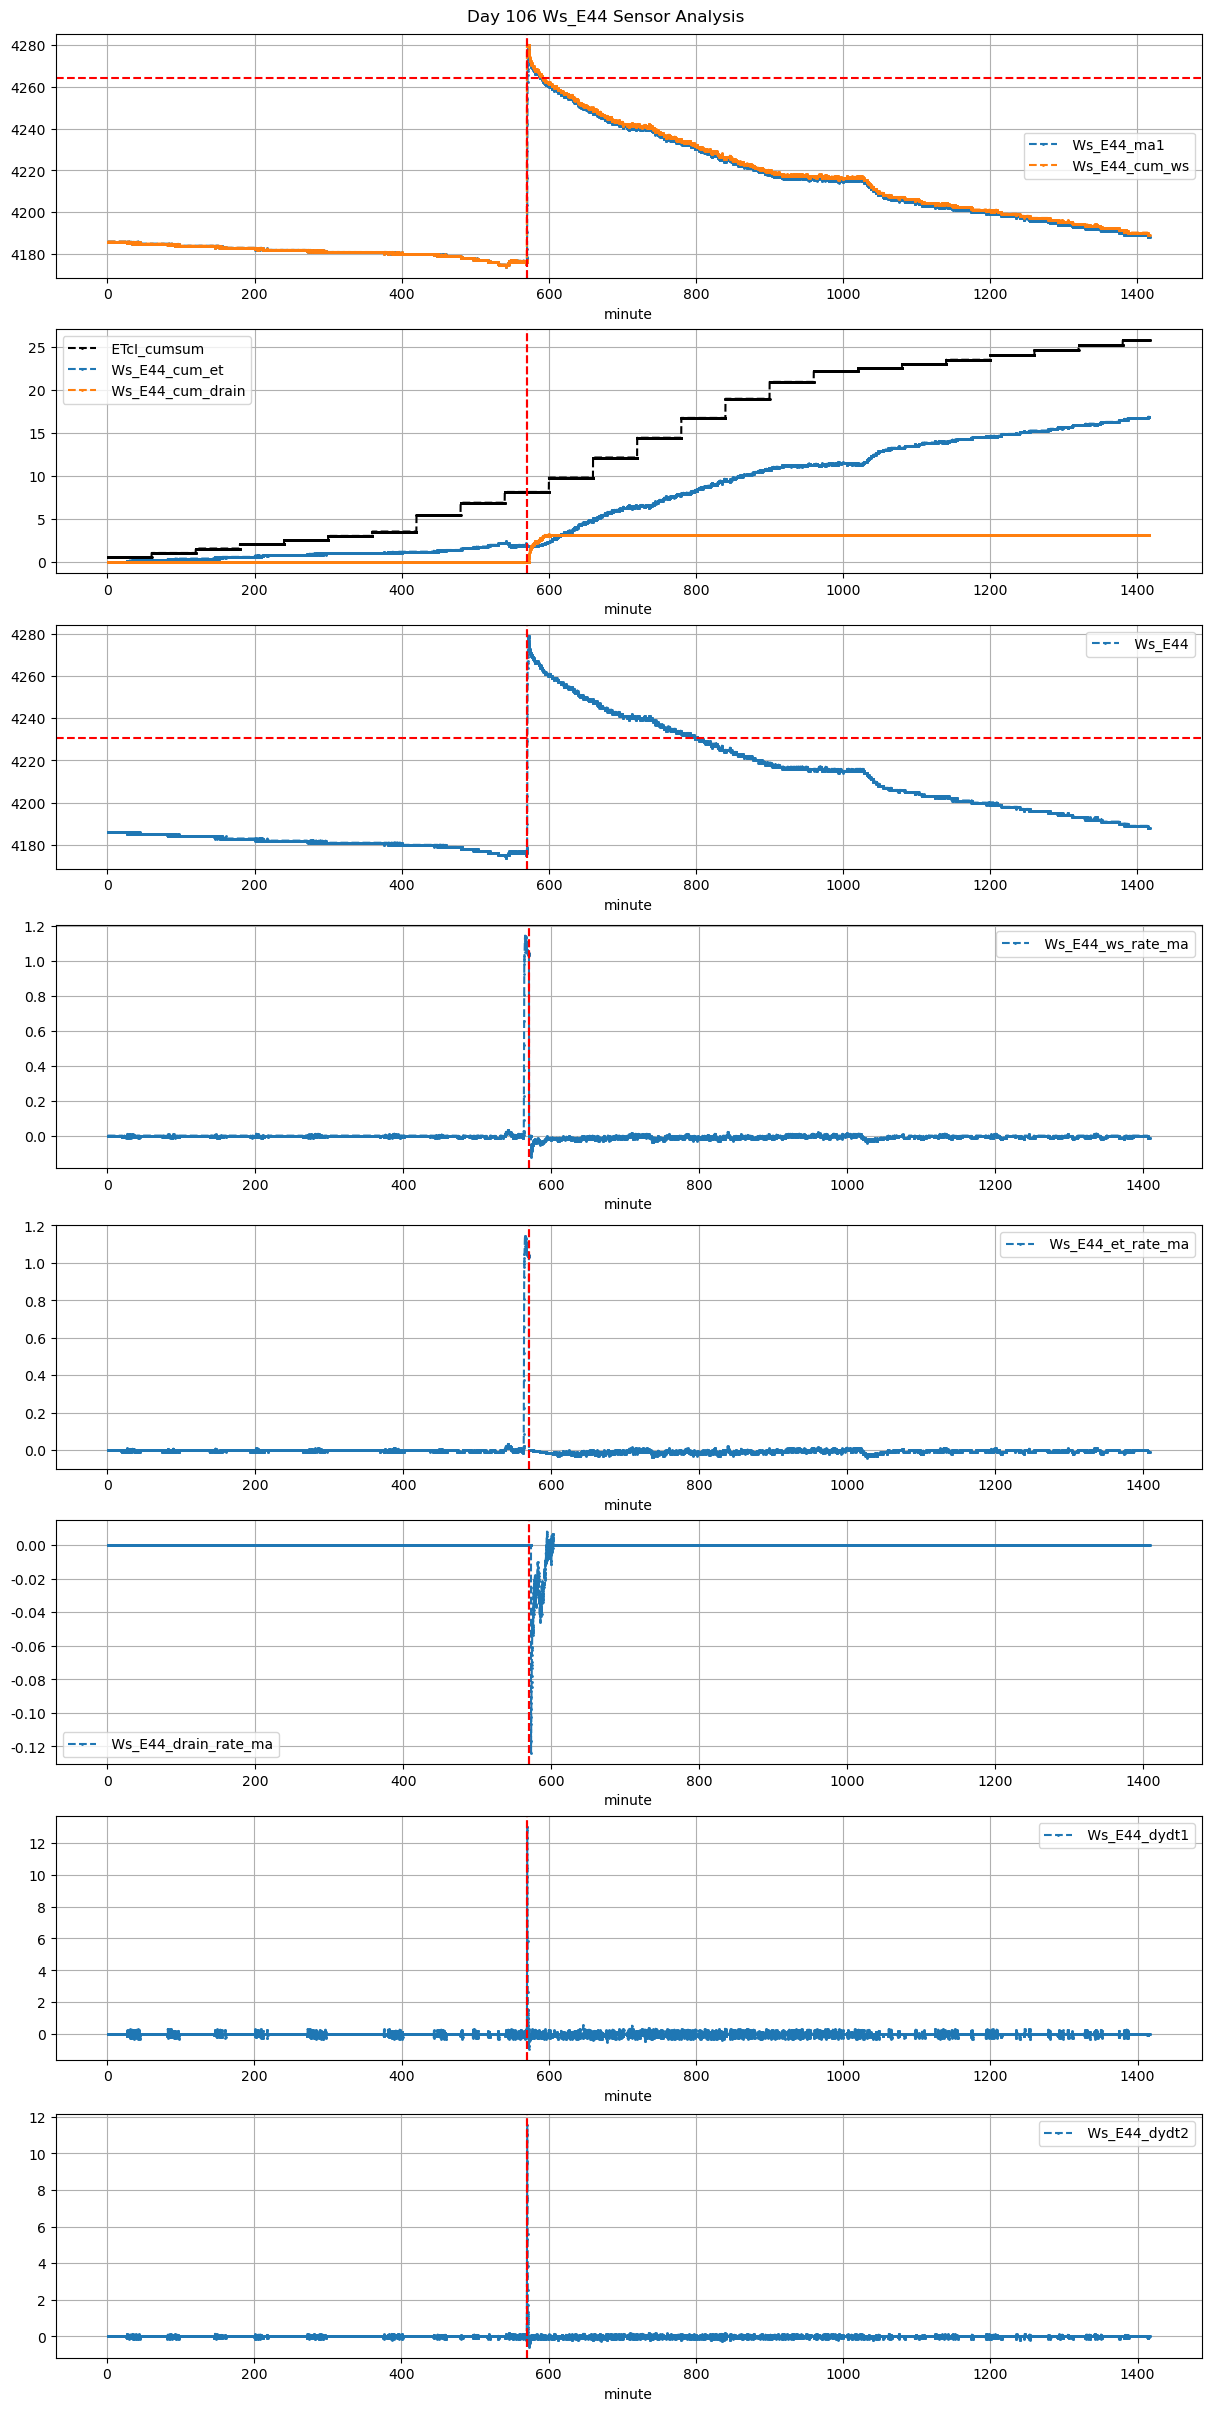
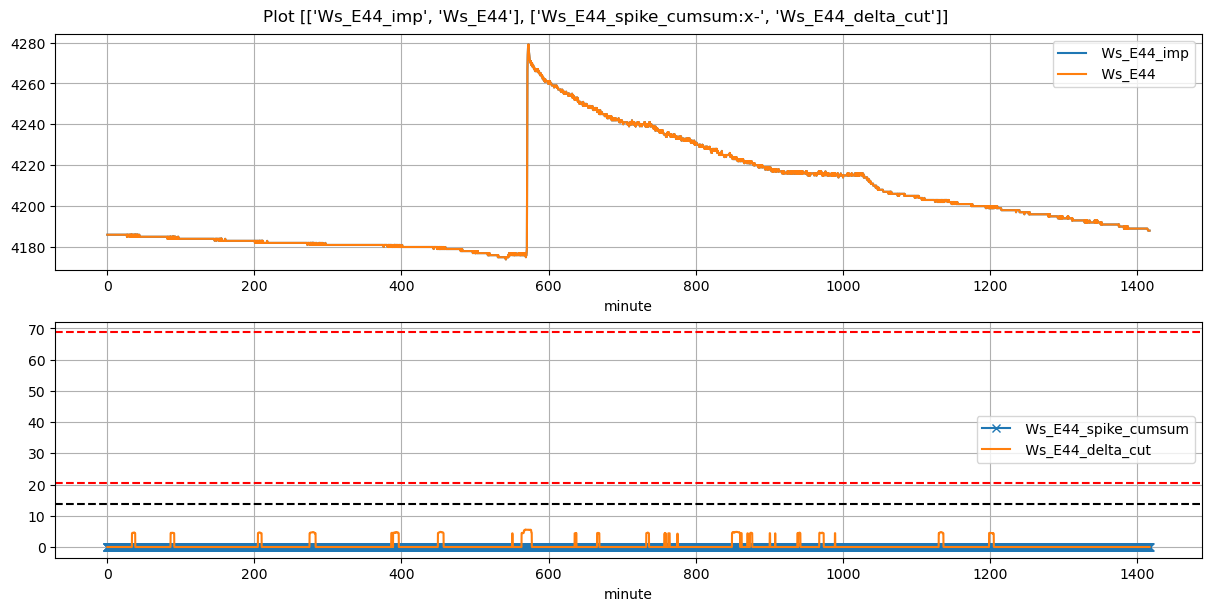
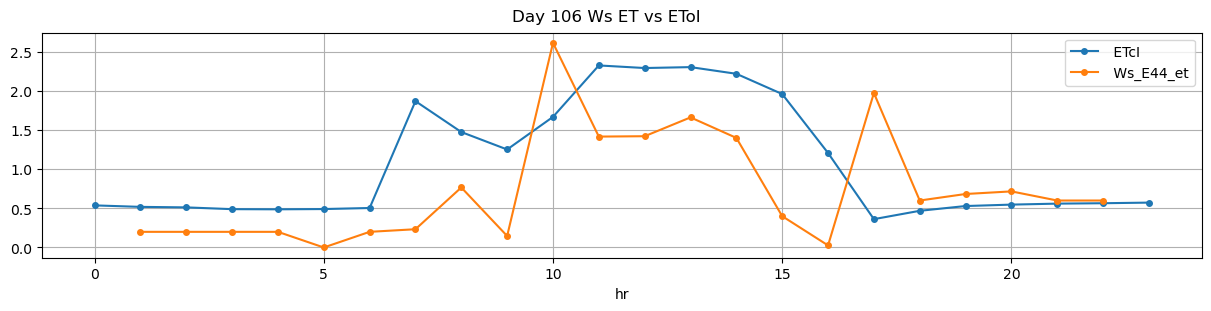
| ds | d | m | ws_name | prominence_cut | max_drain_du | fg_beg | fg_beg_est | fg_end | fg_end_est | ws_beg | ws_end | duc | pre_fg_et | post_fg_ws | post_drn_et | fg_rate_by_dydt | fg_rate_by_dWs | fg_stay_amount | enough_data | fg_beg_delta | fg_end_delta | fg_total_amount | fg_drain_amount | postFg_drain_amount | total_drain_amount | drain_du | drain_delay | drain_rate | field_capacity_est | FVI_1 | FVO_1 |
|---|---|---|---|---|---|---|---|---|---|---|---|---|---|---|---|---|---|---|---|---|---|---|---|---|---|---|---|---|---|---|---|
| 2026-01-20 09:30:00+08:00 | 106 | 570 | Ws_E44 | 0.188654 | 30 | 570.0 | 570.416667 | 570.55 | 572.75 | 4176.0 | 4279.0 | 33 | 0.0 | -0.046975 | -0.018 | 0.299417 | 0.624242 | 20.6 | True | 25.0 | 132.0 | 20.6 | 0.0 | 3.018703 | 3.018703 | 1245 | 137 | -0.061878 | 4263.906486 | NaN | NaN |