VI and VO Daily Summary
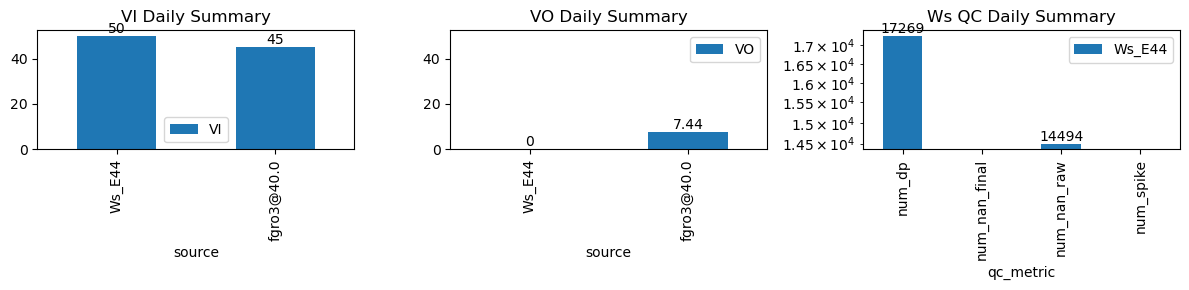
| ws_name | num_dp | num_nan_raw | num_nan_final | num_spike | cum_step_adj |
|---|---|---|---|---|---|
| Ws_E44 | 17,269 | 14,494 | 0 | 0 | 0.00 |
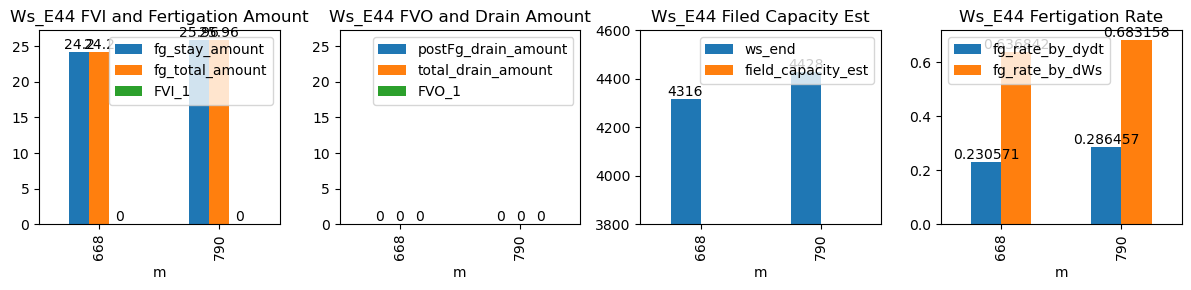
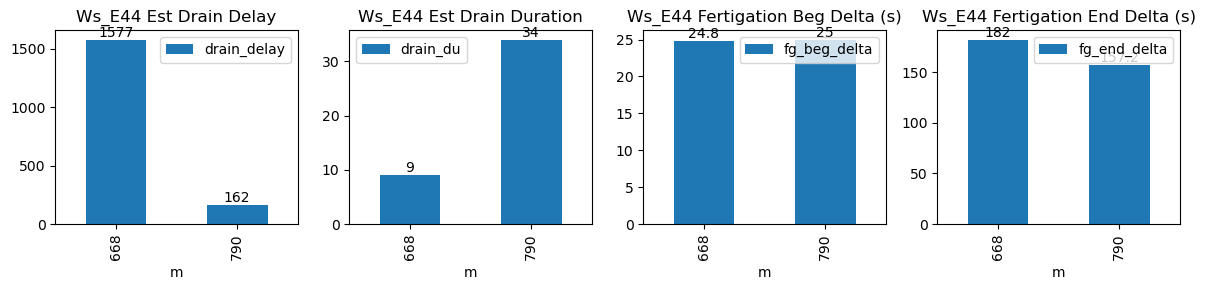
| ds | d | m | ws_name | prominence_cut | max_drain_du | fg_beg | fg_beg_est | fg_end | fg_end_est | ws_beg | ws_end | duc | pre_fg_et | post_fg_ws | post_drn_et | fg_rate_by_dydt | fg_rate_by_dWs | fg_stay_amount | enough_data | fg_beg_delta | fg_end_delta | fg_total_amount | fg_drain_amount | postFg_drain_amount | total_drain_amount | drain_du | drain_delay | drain_rate | field_capacity_est | FVI_1 | FVO_1 |
|---|---|---|---|---|---|---|---|---|---|---|---|---|---|---|---|---|---|---|---|---|---|---|---|---|---|---|---|---|---|---|---|
| 2026-01-31 11:08:40+08:00 | 117 | 668 | Ws_E44 | 0.156141 | 30 | 668.67 | 669.083333 | 669.30 | 672.250000 | 4195.0 | 4316.0 | 38 | -0.016478 | 0.00000 | -0.000833 | 0.238286 | 0.636842 | 24.2 | True | 24.8 | 177.0 | 24.2 | 0.0 | 0 | 0.0 | 15 | 787 | -0.241382 | NaN | NaN | NaN |
| 2026-01-31 13:10:00+08:00 | 117 | 790 | Ws_E44 | 0.156141 | 30 | 790.00 | 790.416667 | 790.63 | 793.166667 | 4298.0 | 4428.0 | 38 | -0.062235 | -0.04456 | -0.032093 | 0.295200 | 0.684211 | 26.0 | True | 25.0 | 152.2 | 26.0 | 0.0 | 0 | 0.0 | 15 | 242 | -0.226947 | NaN | NaN | NaN |