VI and VO Daily Summary
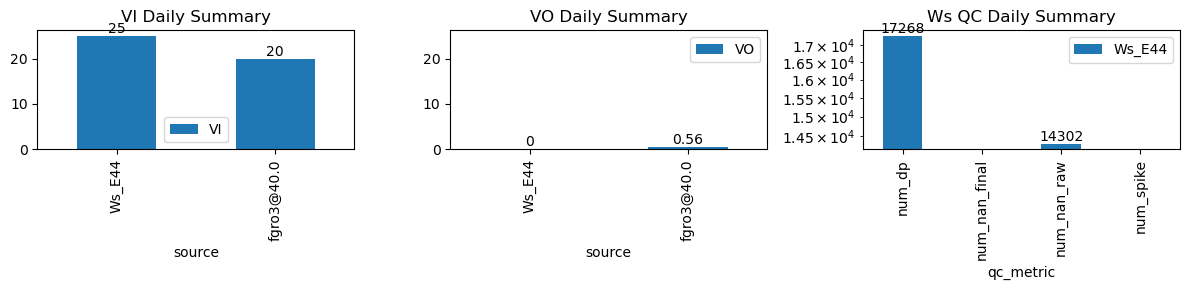
| ws_name | num_dp | num_nan_raw | num_nan_final | num_spike | cum_step_adj |
|---|---|---|---|---|---|
| Ws_E44 | 17,268 | 14,302 | 0 | 0 | 0.00 |
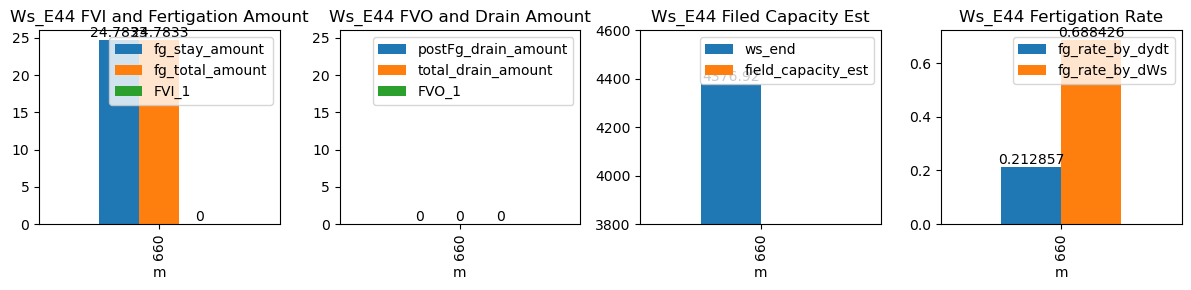
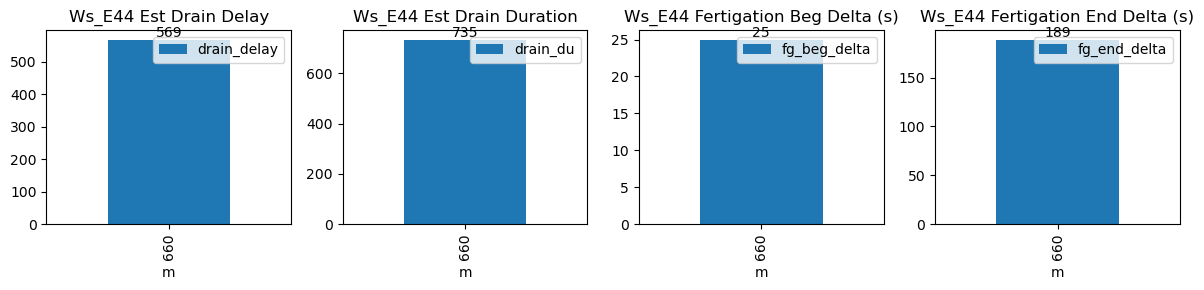
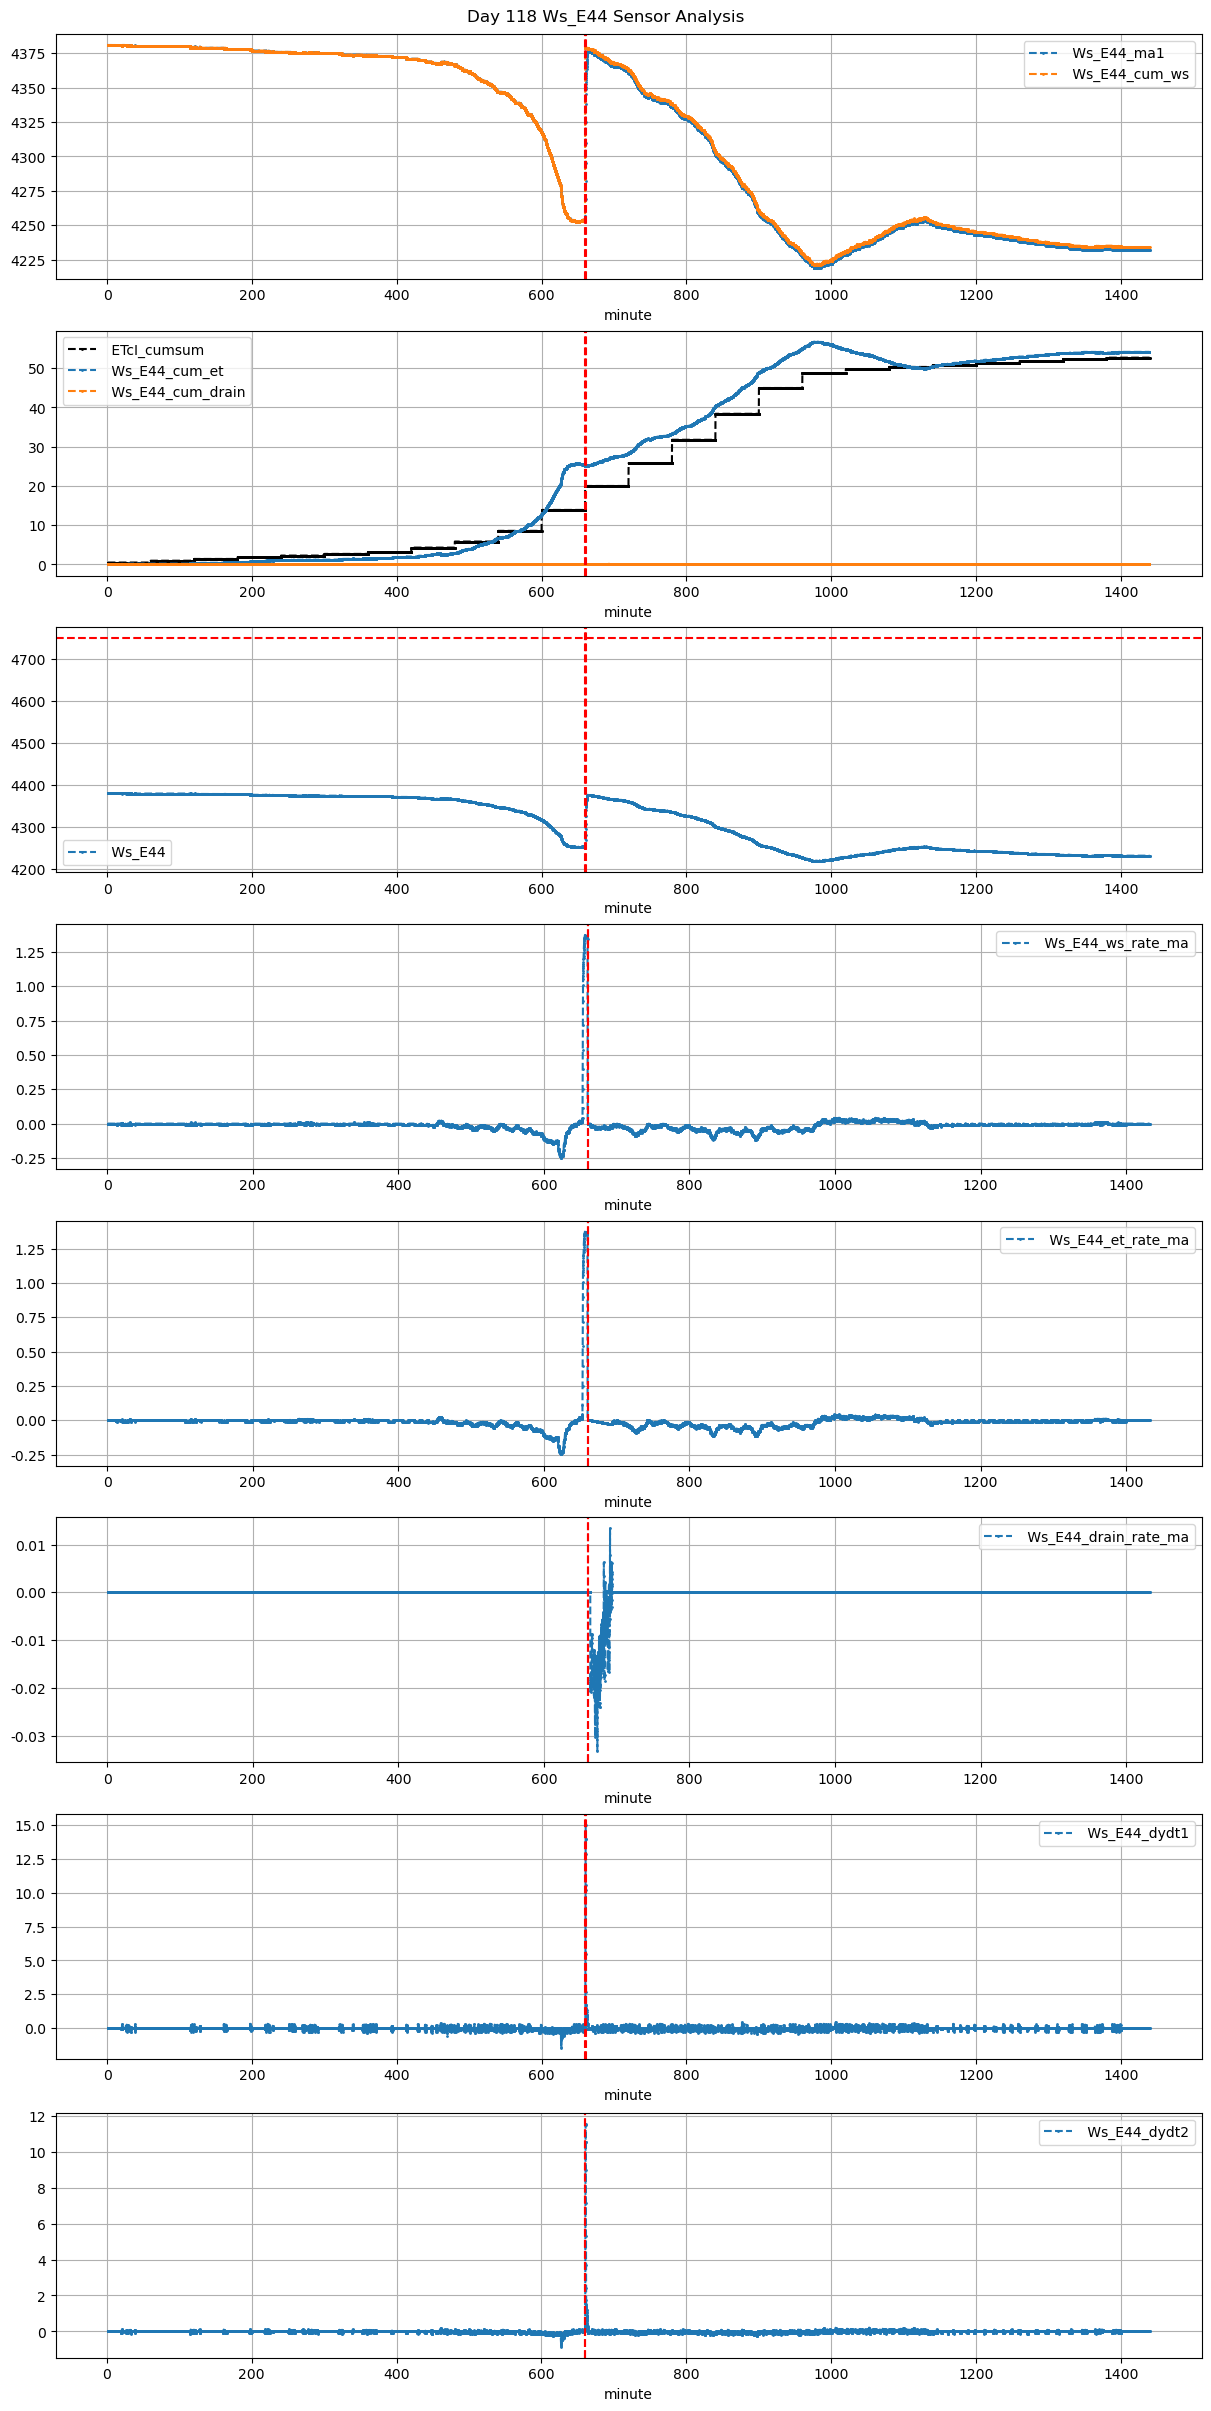
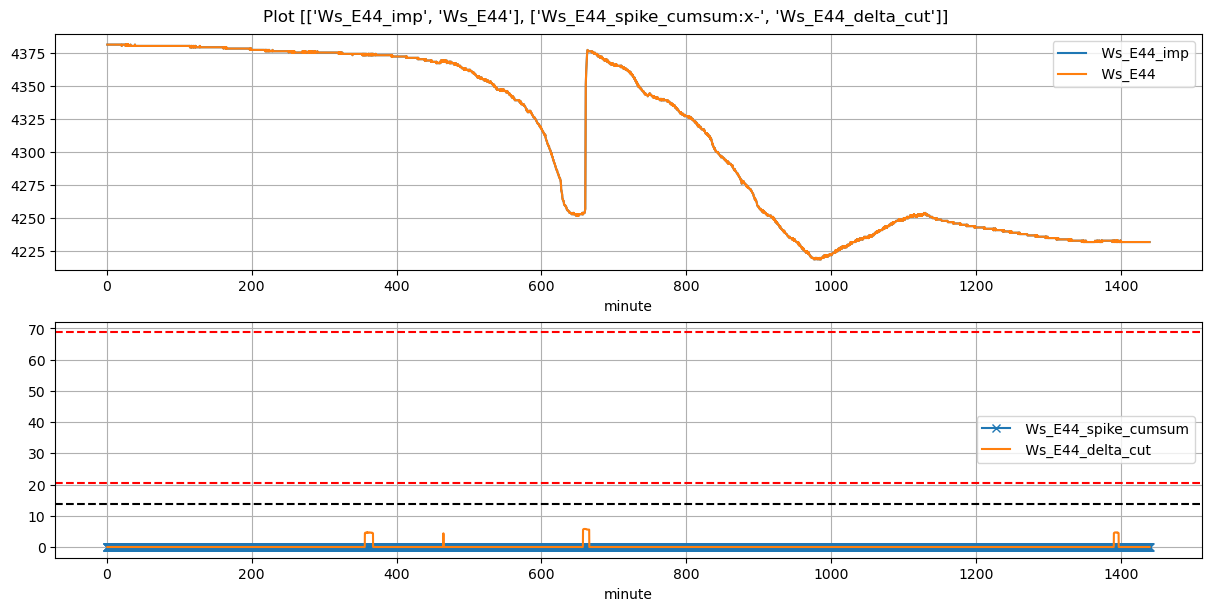
| ds | d | m | ws_name | prominence_cut | max_drain_du | fg_beg | fg_beg_est | fg_end | fg_end_est | ws_beg | ws_end | duc | pre_fg_et | post_fg_ws | post_drn_et | fg_rate_by_dydt | fg_rate_by_dWs | fg_stay_amount | enough_data | fg_beg_delta | fg_end_delta | fg_total_amount | fg_drain_amount | postFg_drain_amount | total_drain_amount | drain_du | drain_delay | drain_rate | field_capacity_est | FVI_1 | FVO_1 |
|---|---|---|---|---|---|---|---|---|---|---|---|---|---|---|---|---|---|---|---|---|---|---|---|---|---|---|---|---|---|---|---|
| 2026-02-01 11:00:00+08:00 | 118 | 660 | Ws_E44 | 0.232378 | 30 | 660.0 | 660.416667 | 660.6 | 663.75 | 4253.0 | 4376.916667 | 36 | 0.0 | -0.022469 | -0.030031 | 0.212857 | 0.688426 | 24.783333 | True | 25.0 | 189.0 | 24.783333 | 0.0 | 0 | 0.0 | 735 | 569 | -0.023944 | NaN | NaN | NaN |