| 2026-02-02 10:00:00+08:00 |
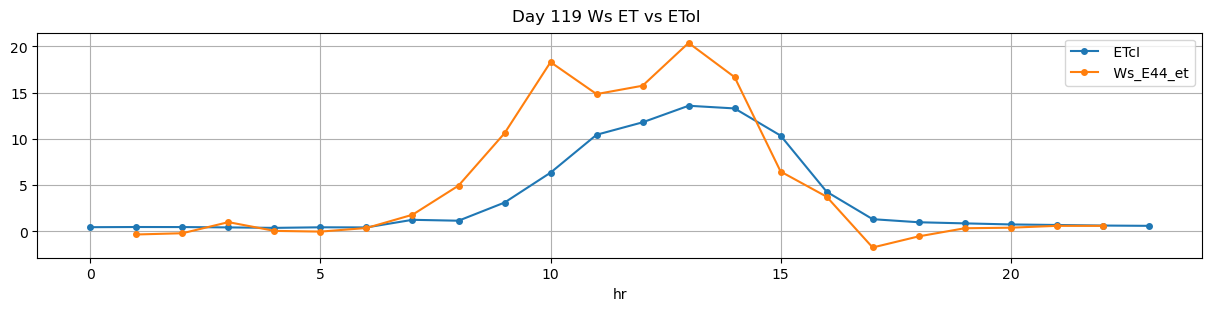
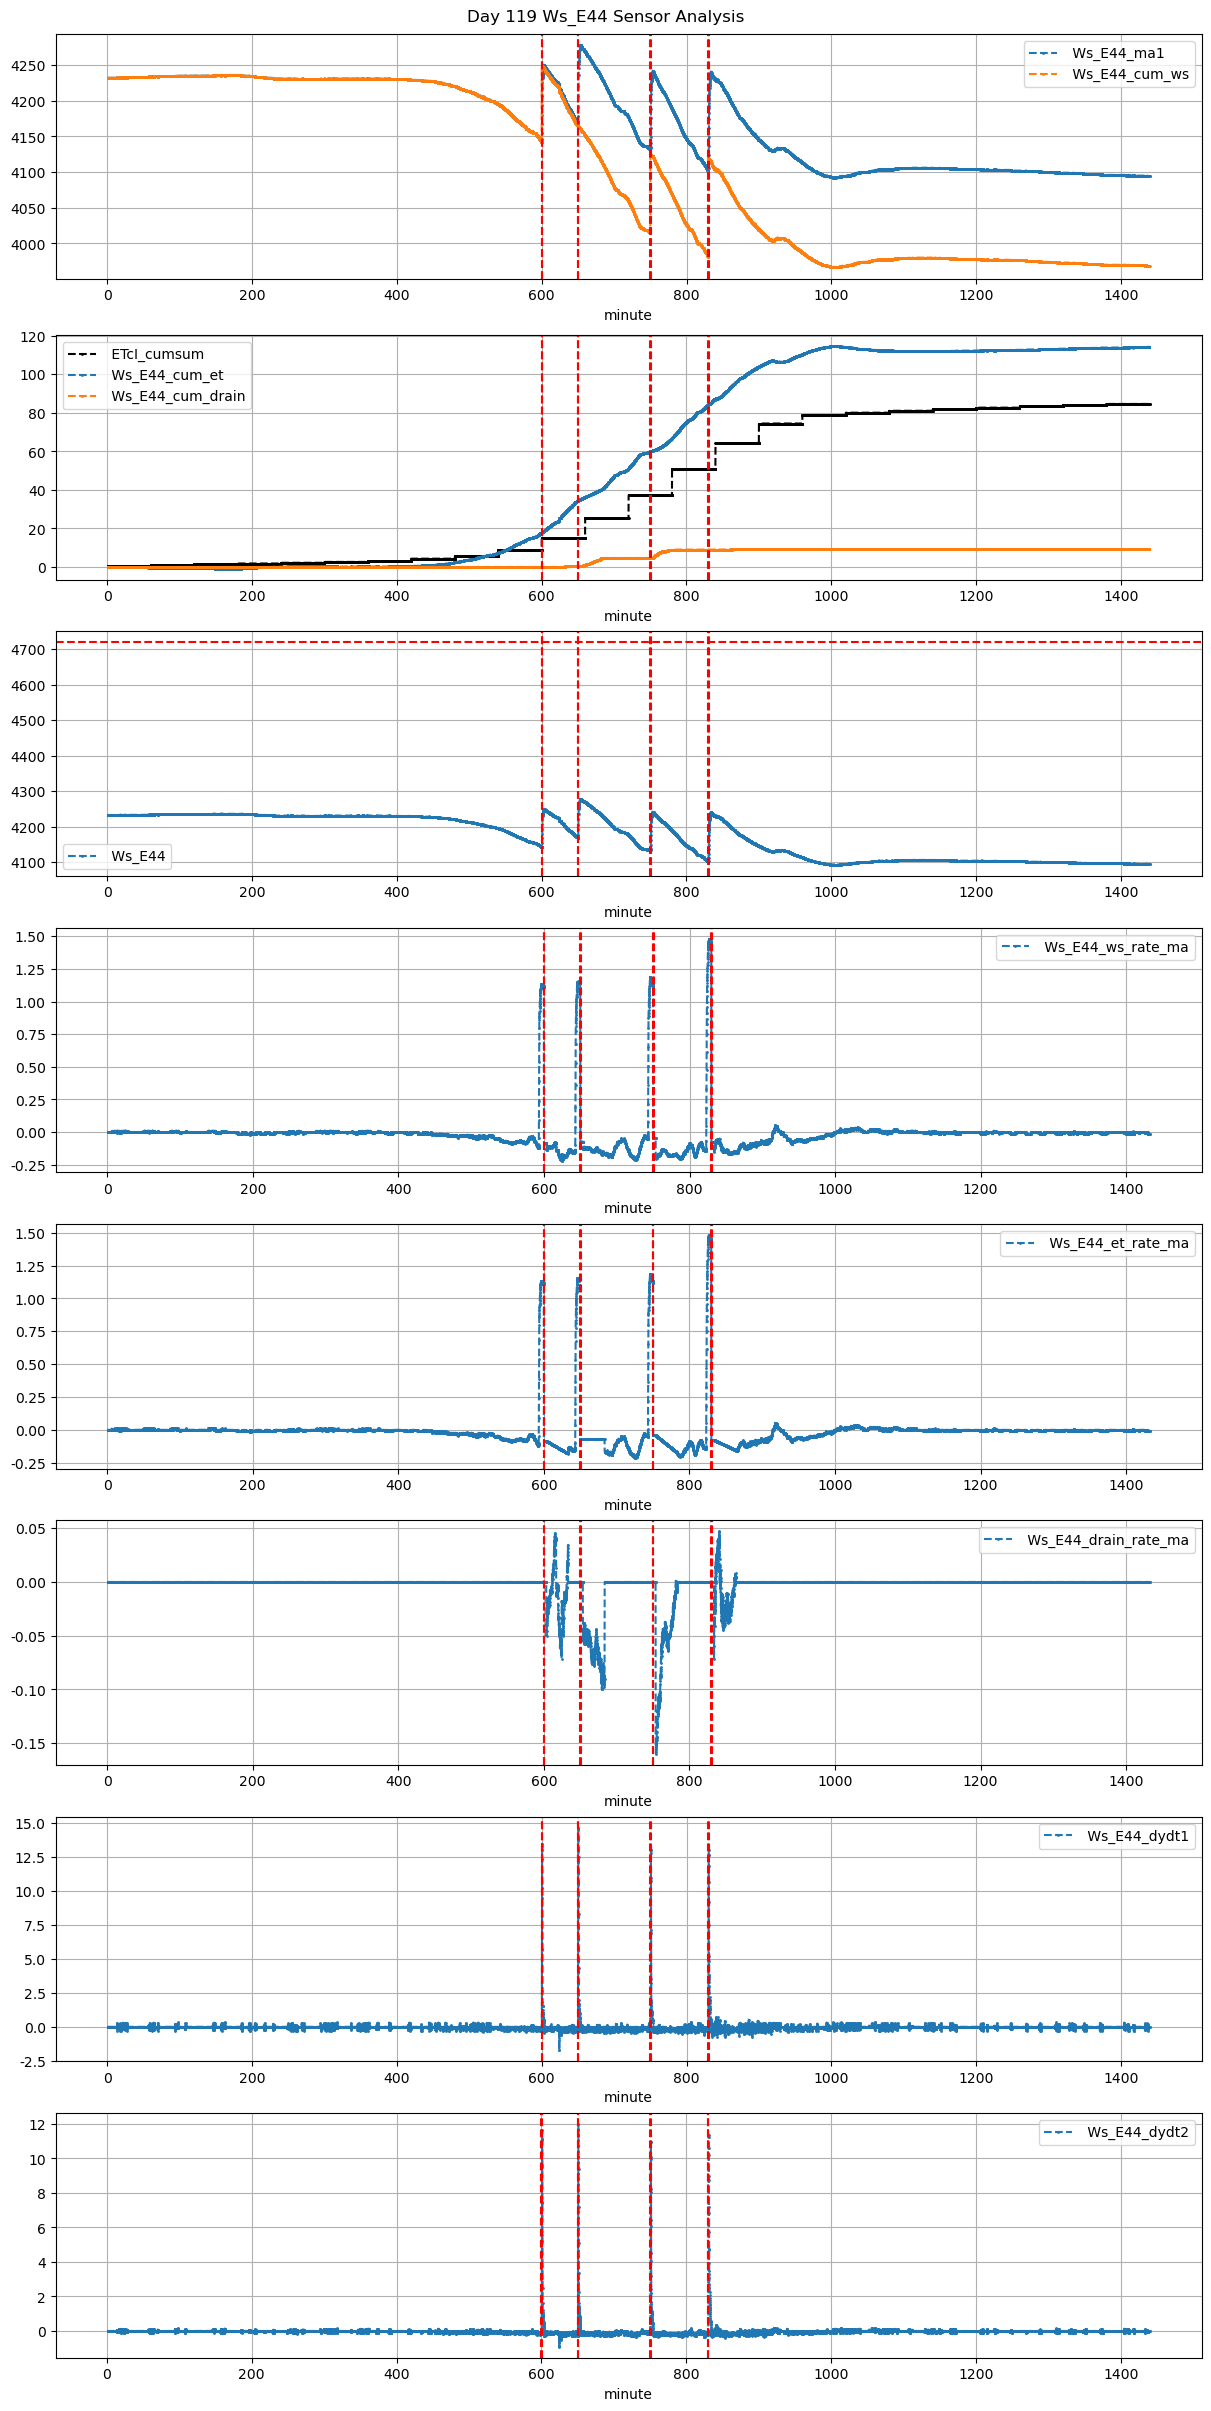
119 |
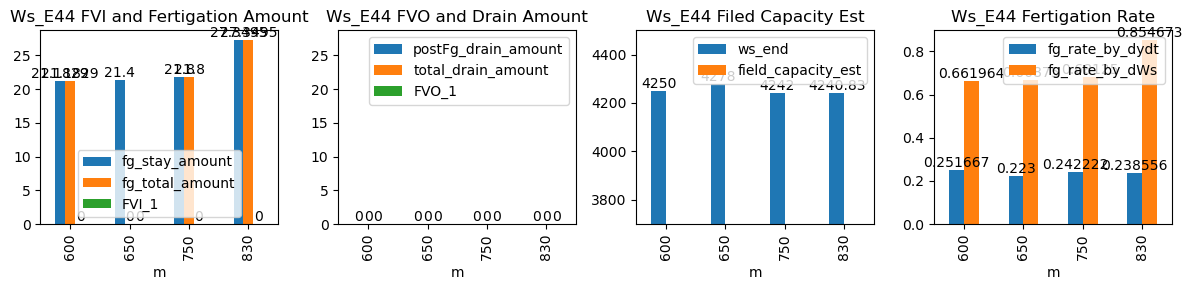
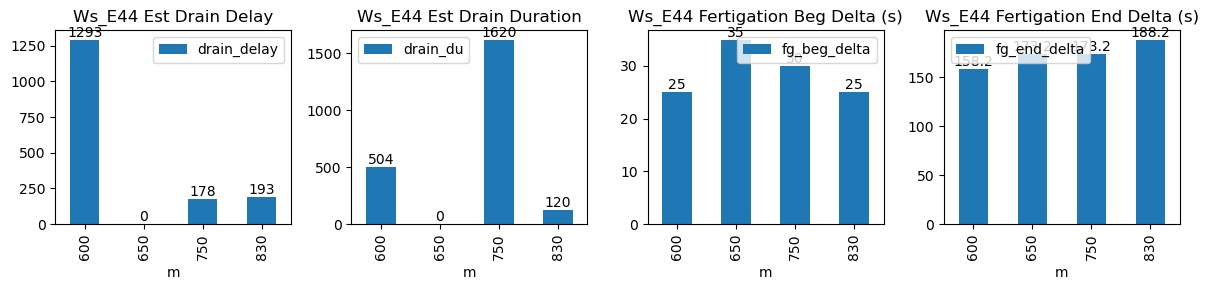
600 |
Ws_E44 |
0.353505 |
30 |
600.0 |
600.416667 |
600.53 |
603.166667 |
4144.085714 |
4250.000000 |
32 |
-0.084956 |
-0.116764 |
-0.180185 |
0.251667 |
0.661964 |
21.182857 |
True |
25.0 |
158.2 |
21.182857 |
0.0 |
0.0 |
0.0 |
504.0 |
1293.0 |
-0.058432 |
NaN |
NaN |
NaN |
| 2026-02-02 10:50:00+08:00 |
119 |
650 |
Ws_E44 |
0.353505 |
30 |
650.0 |
650.583333 |
650.53 |
653.416667 |
4171.000000 |
4278.000000 |
32 |
-0.072582 |
-0.122037 |
-0.072582 |
0.223000 |
0.668750 |
21.400000 |
False |
35.0 |
173.2 |
NaN |
NaN |
NaN |
NaN |
NaN |
NaN |
NaN |
NaN |
NaN |
NaN |
| 2026-02-02 12:30:00+08:00 |
119 |
750 |
Ws_E44 |
0.353505 |
30 |
750.0 |
750.500000 |
750.53 |
753.416667 |
4133.000000 |
4242.000000 |
32 |
-0.042176 |
-0.178107 |
-0.174621 |
0.242222 |
0.681250 |
21.800000 |
True |
30.0 |
173.2 |
21.800000 |
0.0 |
0.0 |
0.0 |
1620.0 |
178.0 |
-0.144811 |
NaN |
NaN |
NaN |
| 2026-02-02 13:50:00+08:00 |
119 |
830 |
Ws_E44 |
0.353505 |
30 |
830.0 |
830.416667 |
830.53 |
833.666667 |
4104.085714 |
4240.833333 |
32 |
-0.117780 |
-0.077603 |
-0.155062 |
0.238556 |
0.854673 |
27.349524 |
True |
25.0 |
188.2 |
27.349524 |
0.0 |
0.0 |
0.0 |
120.0 |
193.0 |
-0.039099 |
NaN |
NaN |
NaN |