| 2026-02-08 10:22:29+08:00 |
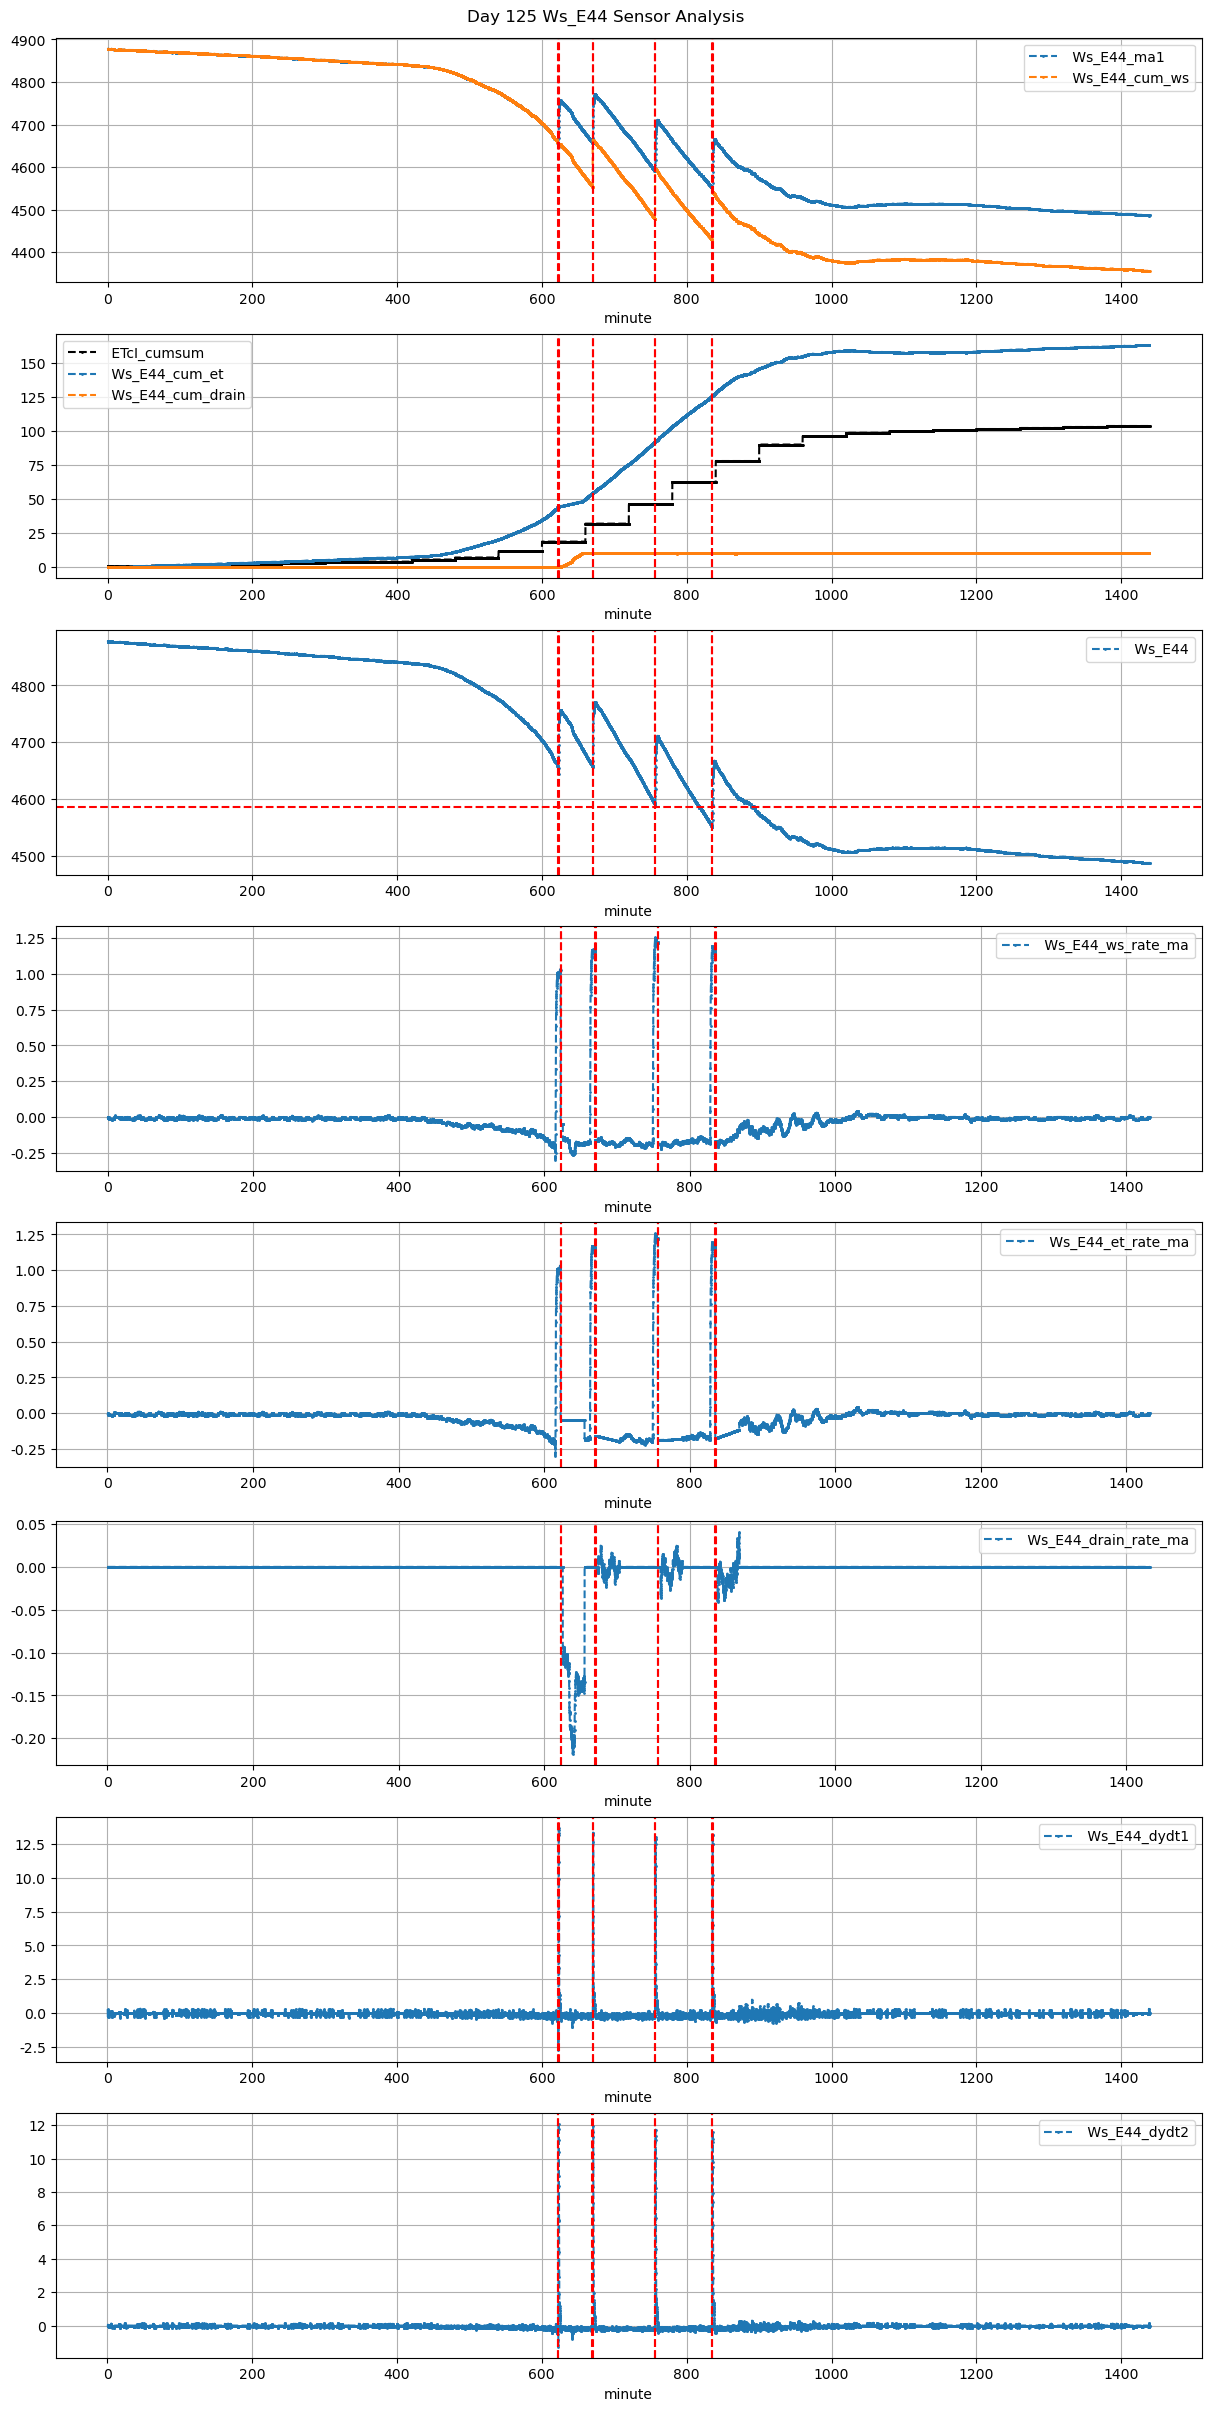
125 |
622 |
Ws_E44 |
0.418028 |
30 |
622.48 |
623.083333 |
623.03 |
625.500000 |
4659.600000 |
4756.822222 |
33 |
-0.048872 |
-0.155381 |
-0.048872 |
0.269333 |
0.589226 |
19.444444 |
False |
36.2 |
148.2 |
NaN |
0.0 |
0.0 |
0.0 |
NaN |
NaN |
NaN |
NaN |
NaN |
NaN |
| 2026-02-08 11:10:00+08:00 |
125 |
670 |
Ws_E44 |
0.418028 |
30 |
670.00 |
670.416667 |
670.55 |
673.166667 |
4660.866667 |
4771.000000 |
33 |
-0.181778 |
-0.160212 |
-0.197420 |
0.269667 |
0.667475 |
22.026667 |
True |
25.0 |
157.0 |
22.026667 |
0.0 |
0.0 |
0.0 |
450.0 |
682.0 |
-0.015598 |
NaN |
NaN |
NaN |
| 2026-02-08 12:36:14+08:00 |
125 |
756 |
Ws_E44 |
0.418028 |
30 |
756.23 |
756.666667 |
756.78 |
759.750000 |
4593.160000 |
4711.000000 |
33 |
-0.187932 |
-0.188657 |
-0.181276 |
0.240667 |
0.714182 |
23.568000 |
True |
26.2 |
178.2 |
23.568000 |
0.0 |
0.0 |
0.0 |
109.0 |
183.0 |
-0.026287 |
NaN |
NaN |
NaN |
| 2026-02-08 13:55:00+08:00 |
125 |
835 |
Ws_E44 |
0.418028 |
30 |
835.00 |
835.500000 |
835.55 |
838.083333 |
4553.700000 |
4667.000000 |
33 |
-0.170911 |
-0.176620 |
-0.115864 |
0.285333 |
0.686667 |
22.660000 |
True |
30.0 |
152.0 |
22.660000 |
0.0 |
0.0 |
0.0 |
155.0 |
157.0 |
-0.034280 |
NaN |
NaN |
NaN |