| 2026-02-09 08:27:30+08:00 |
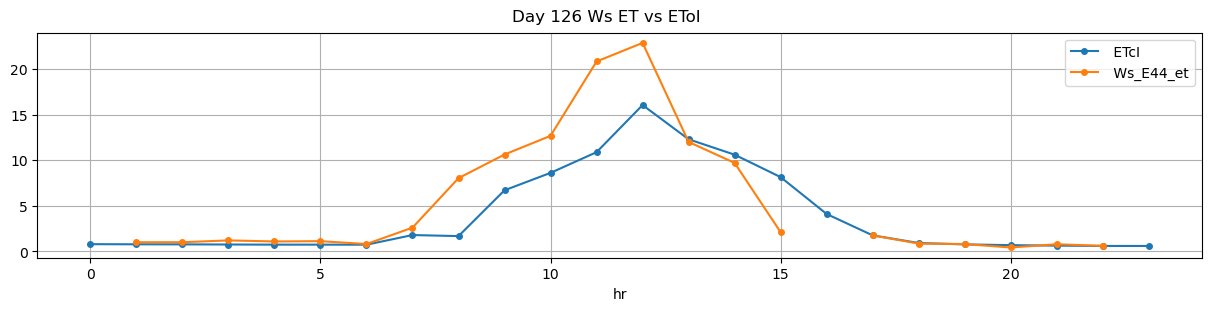
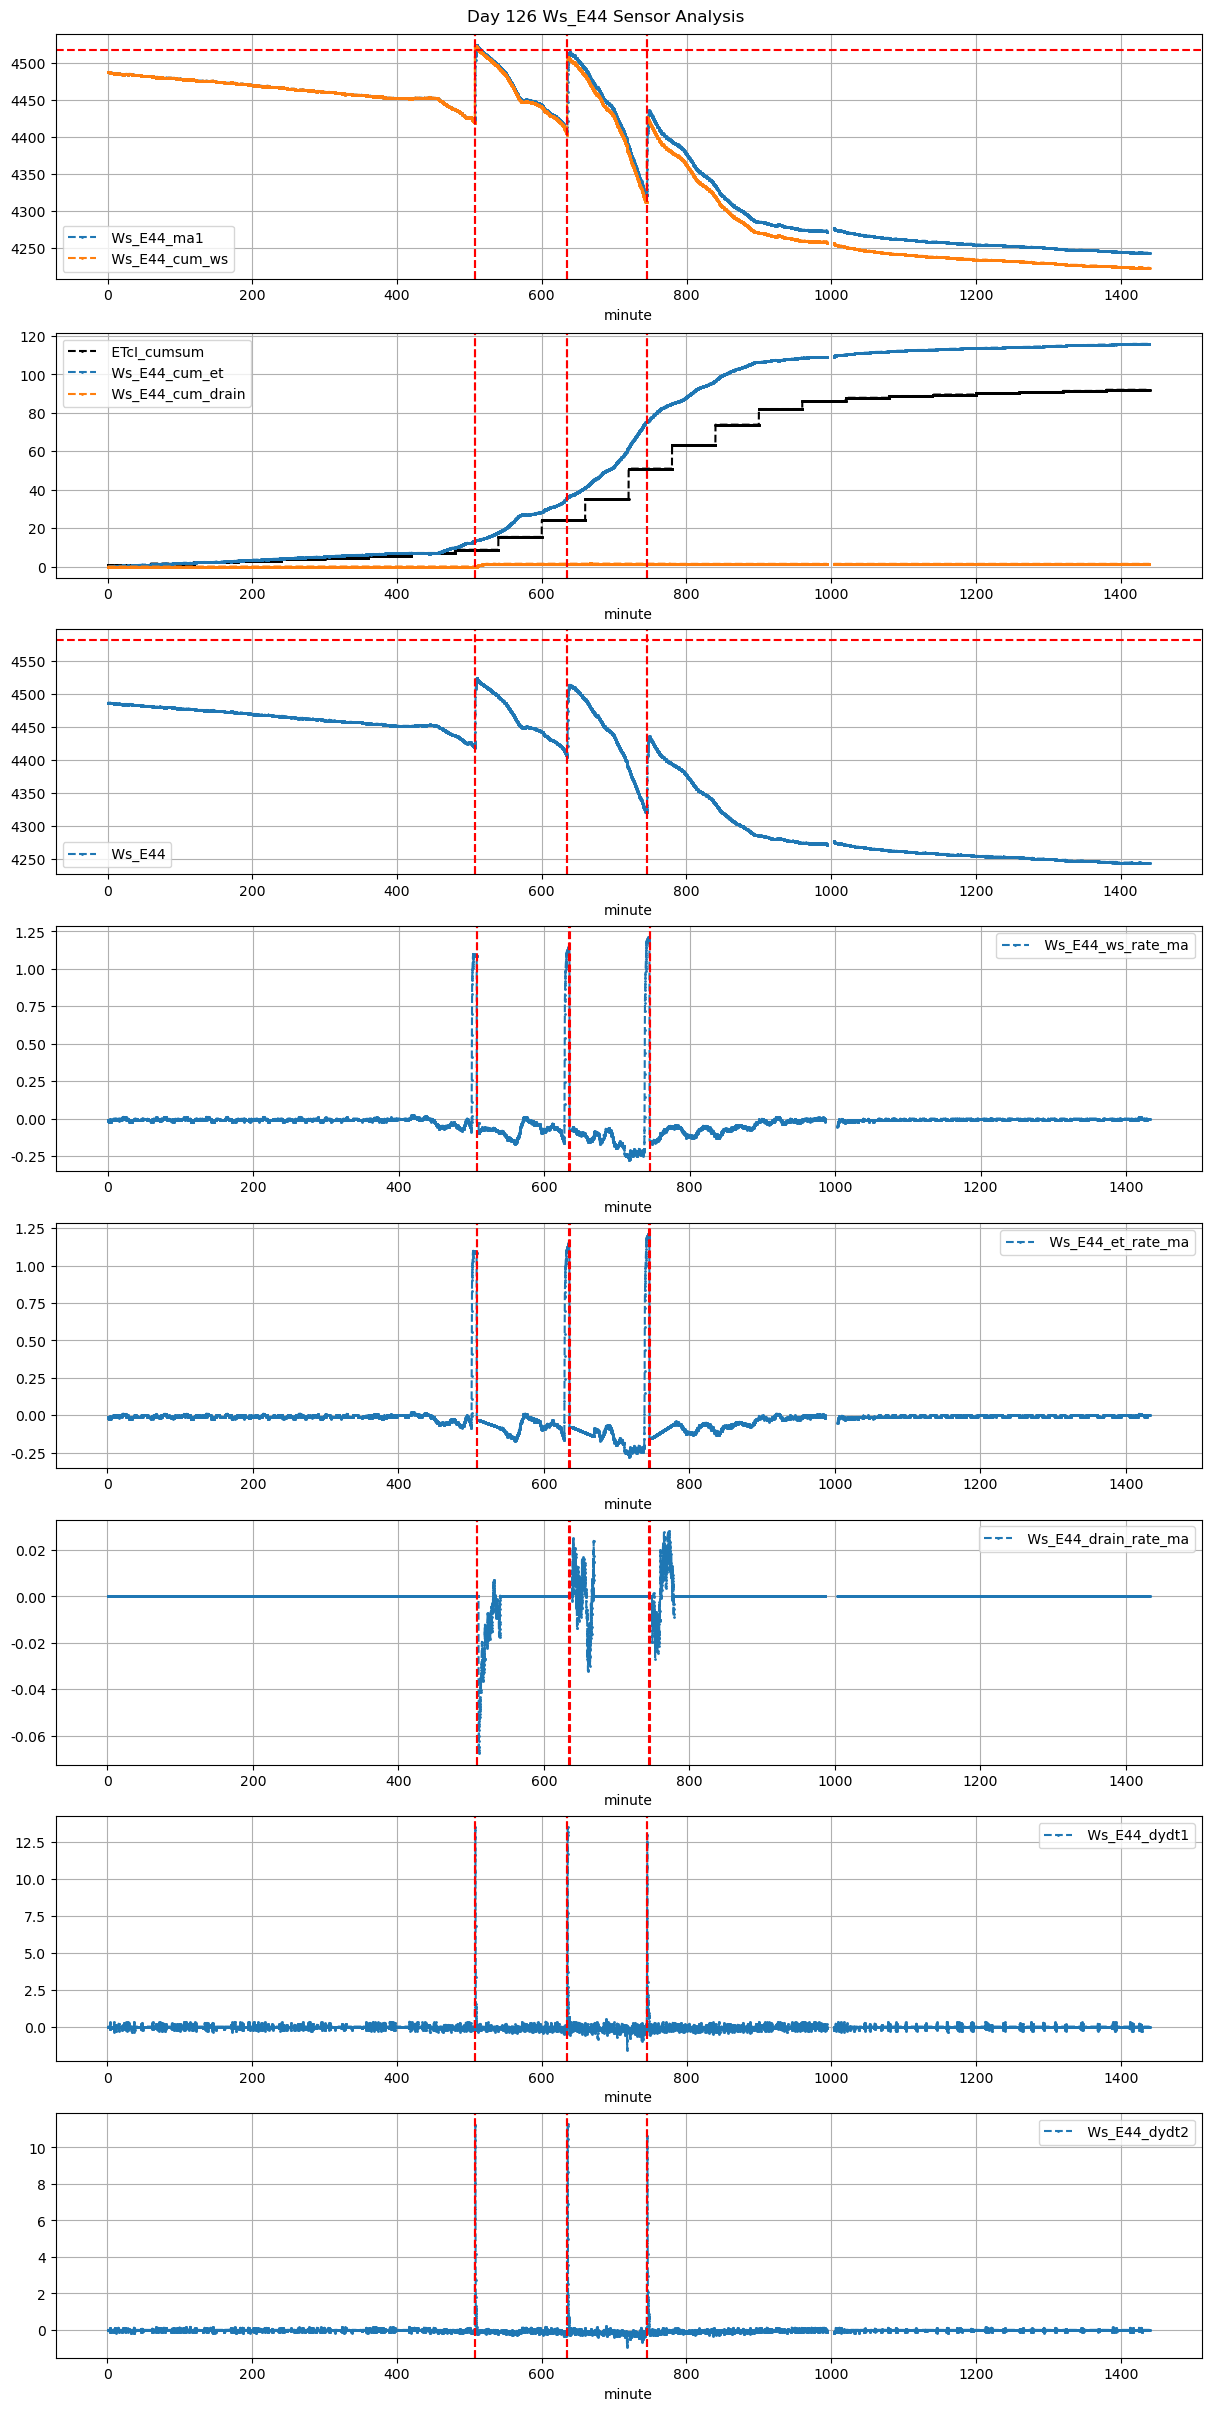
126 |
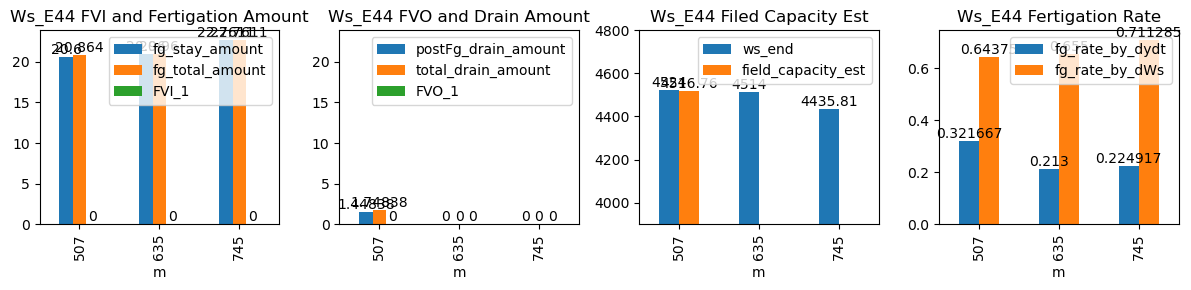
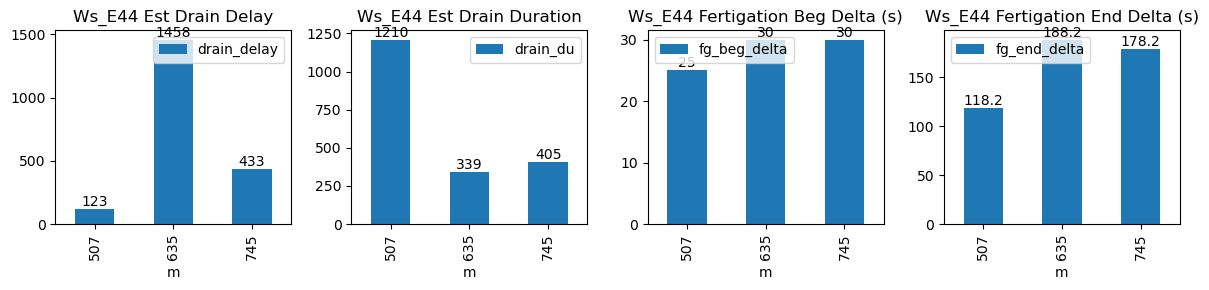
507 |
Ws_E44 |
0.34283 |
30 |
507.5 |
507.916667 |
508.03 |
510.000000 |
4421.0 |
4524.000000 |
32 |
-0.031117 |
-0.076384 |
-0.083587 |
0.321667 |
0.643750 |
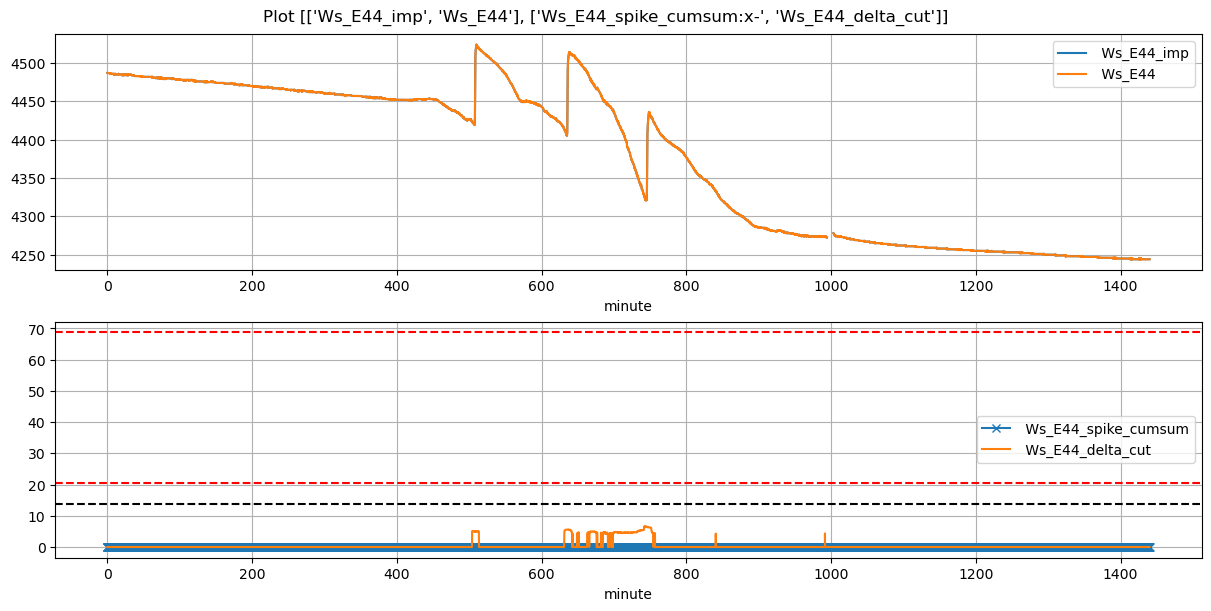
20.600000 |
True |
25.0 |
118.2 |
20.864000 |
0.3 |
1.448382 |
1.748382 |
1210 |
123 |
-0.051417 |
4516.758089 |
NaN |
NaN |
| 2026-02-09 10:35:00+08:00 |
126 |
635 |
Ws_E44 |
0.34283 |
30 |
635.0 |
635.500000 |
635.53 |
638.666667 |
4409.2 |
4514.000000 |
32 |
-0.109555 |
-0.079029 |
-0.140156 |
0.213000 |
0.655000 |
20.960000 |
True |
30.0 |
188.2 |
20.960000 |
0.0 |
0.000000 |
0.000000 |
339 |
1458 |
-0.026394 |
NaN |
NaN |
NaN |
| 2026-02-09 12:25:00+08:00 |
126 |
745 |
Ws_E44 |
0.34283 |
30 |
745.0 |
745.500000 |
745.53 |
748.500000 |
4322.0 |
4435.805556 |
32 |
-0.226040 |
-0.149879 |
-0.057449 |
0.224917 |
0.711285 |
22.761111 |
True |
30.0 |
178.2 |
22.761111 |
0.0 |
0.000000 |
0.000000 |
405 |
433 |
-0.021198 |
NaN |
NaN |
NaN |