| 2026-02-10 08:22:31+08:00 |
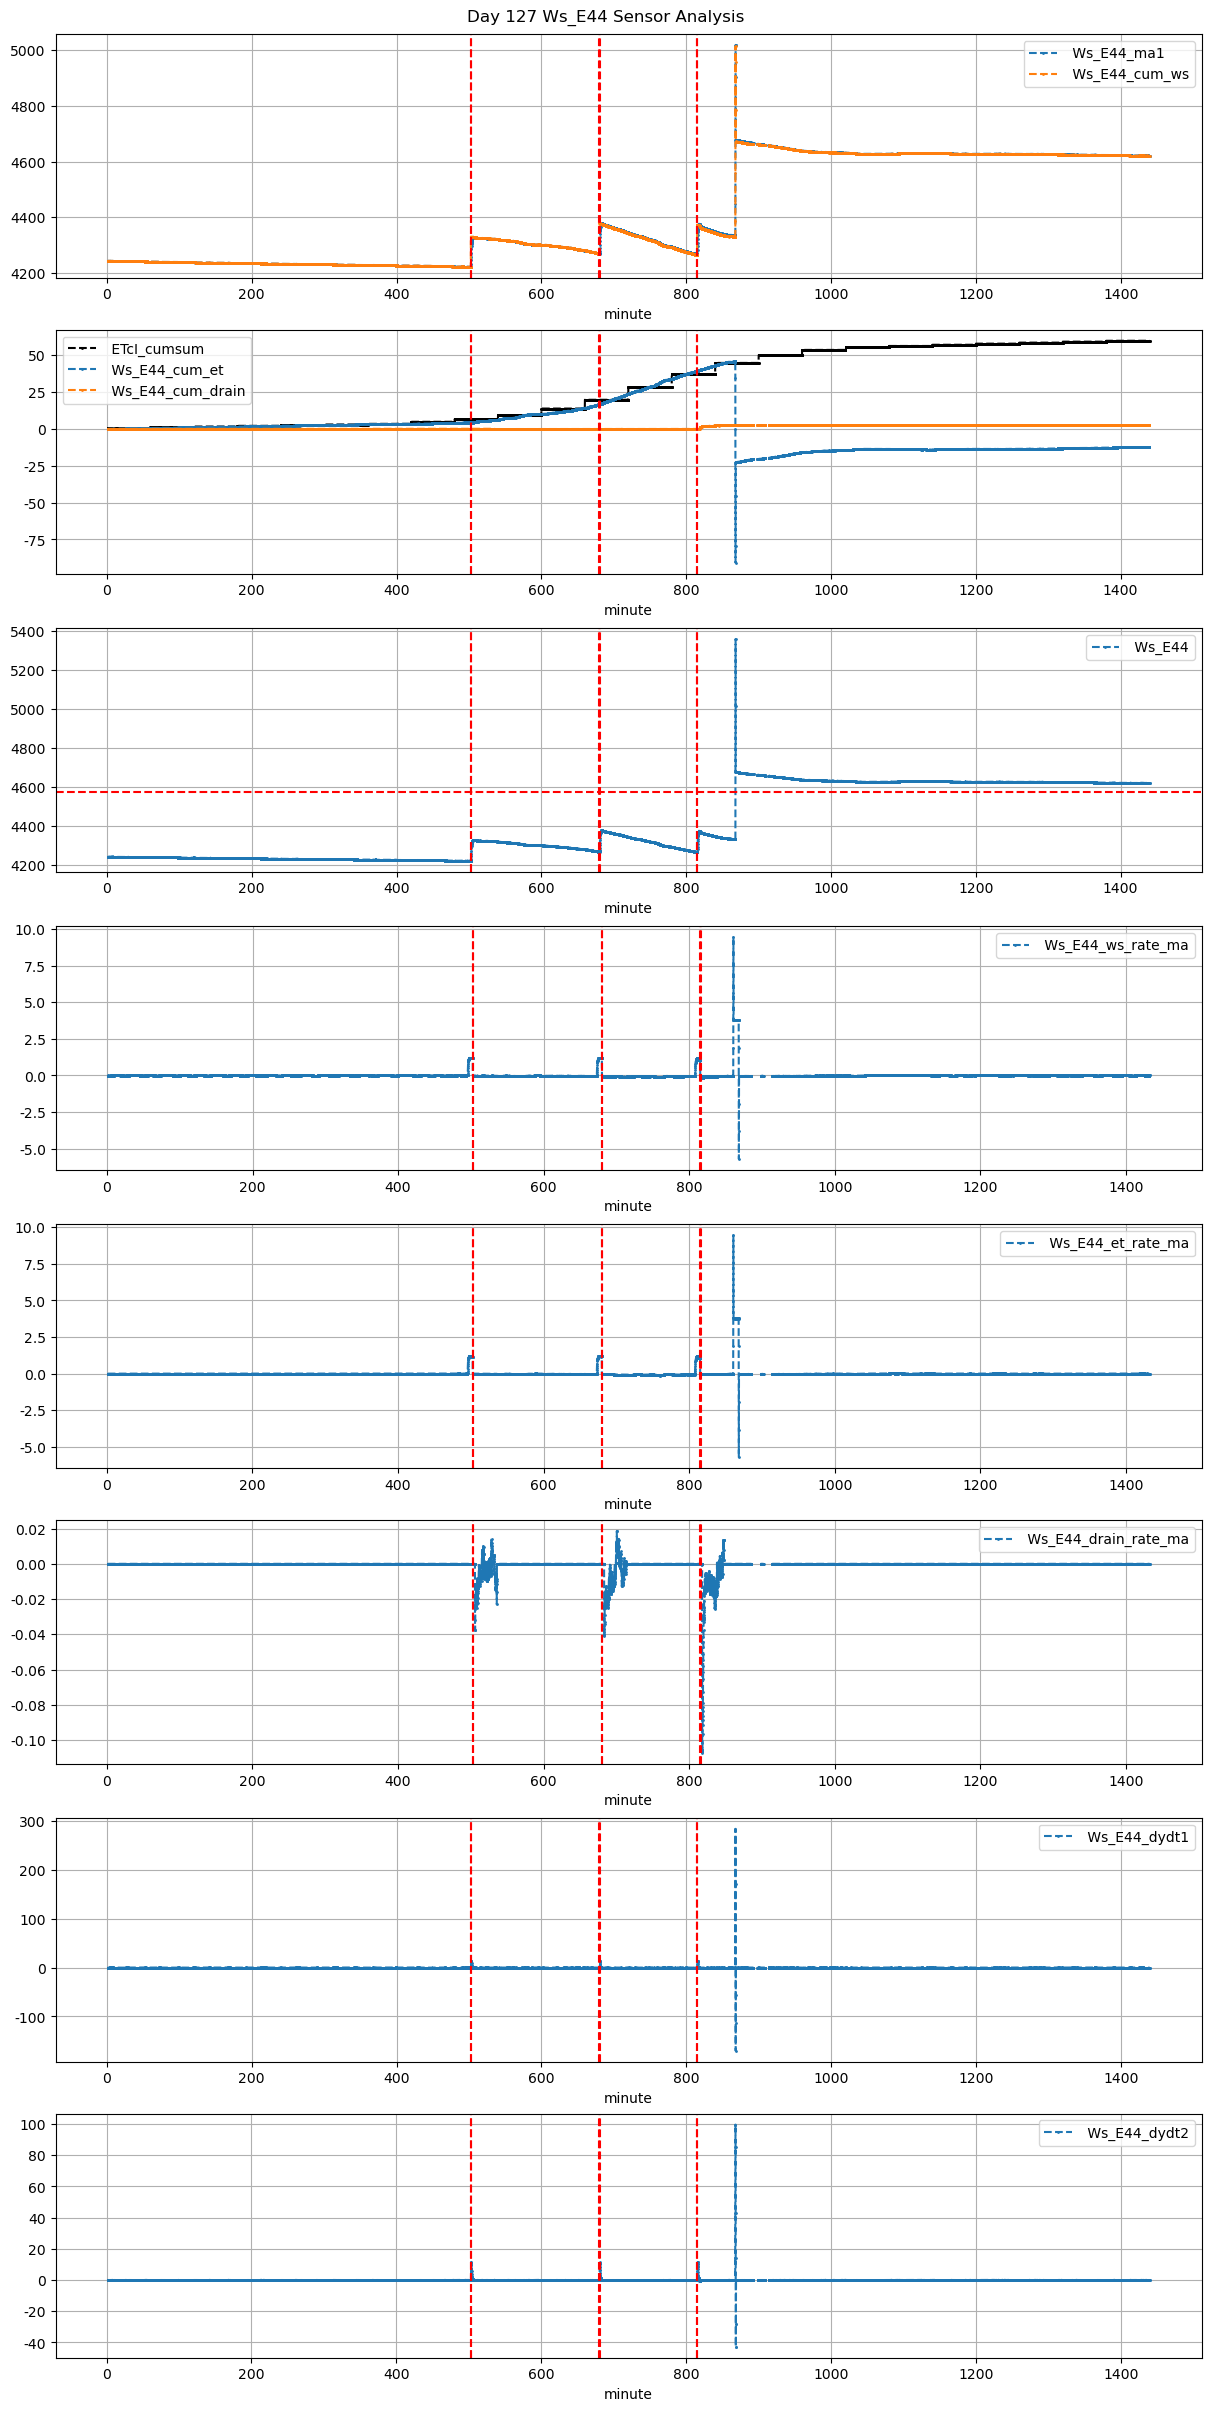
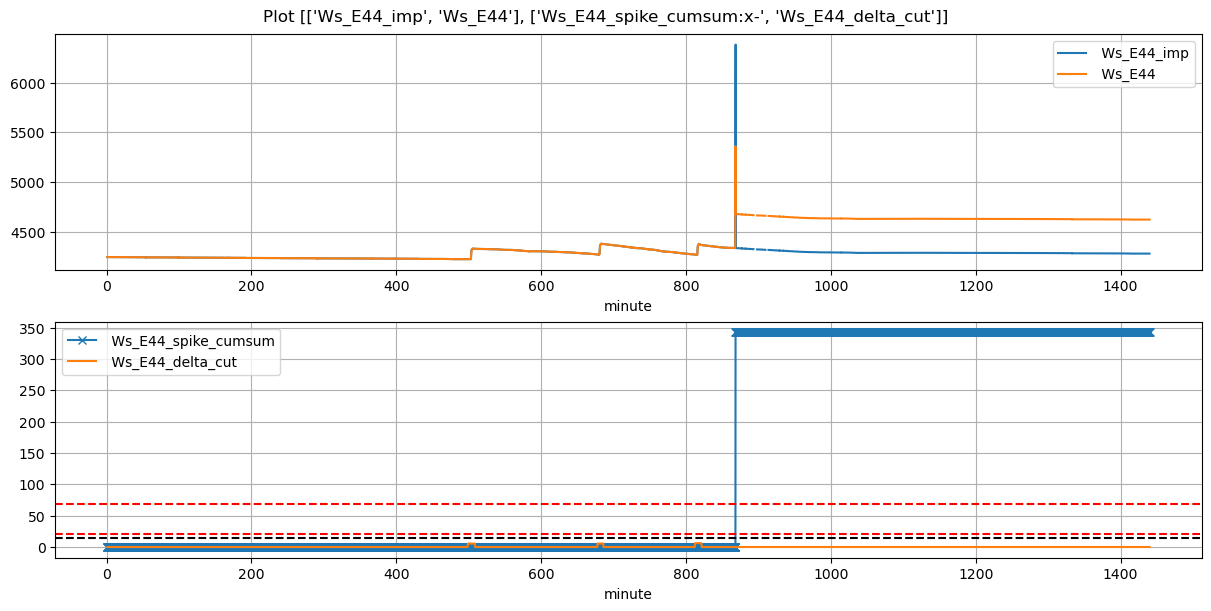
127 |
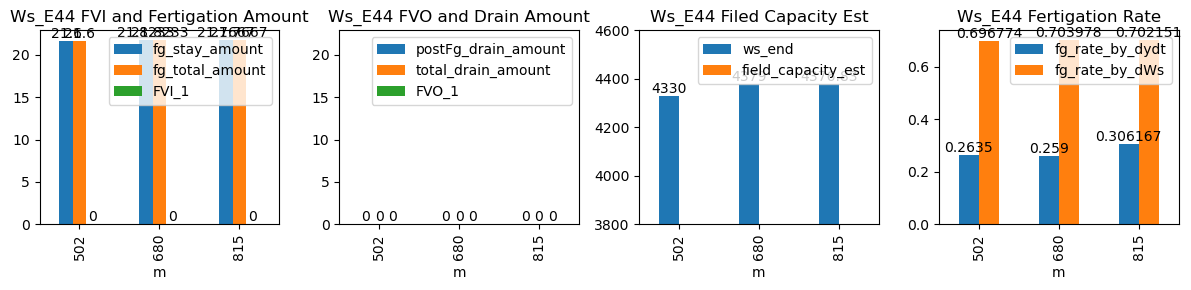
502 |
Ws_E44 |
5.055934 |
30 |
502.52 |
503.000000 |
503.04 |
505.666667 |
4222.000000 |
4330.000000 |
31 |
-0.006723 |
-0.021734 |
-0.017840 |
0.263500 |
0.696774 |
21.600000 |
True |
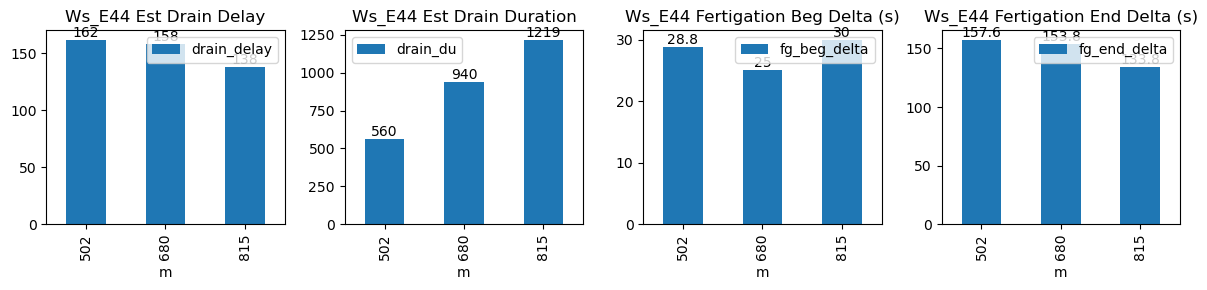
28.8 |
157.6 |
21.600000 |
0.0 |
0.0 |
0.0 |
560 |
162 |
-0.021275 |
NaN |
NaN |
NaN |
| 2026-02-10 11:20:00+08:00 |
127 |
680 |
Ws_E44 |
5.055934 |
30 |
680.00 |
680.416667 |
680.52 |
683.083333 |
4269.883333 |
4379.000000 |
31 |
-0.051685 |
-0.075790 |
-0.080632 |
0.259000 |
0.703978 |
21.823333 |
True |
25.0 |
153.8 |
21.823333 |
0.0 |
0.0 |
0.0 |
940 |
158 |
-0.024859 |
NaN |
NaN |
NaN |
| 2026-02-10 13:35:00+08:00 |
127 |
815 |
Ws_E44 |
5.055934 |
30 |
815.00 |
815.500000 |
815.52 |
817.750000 |
4268.000000 |
4376.833333 |
31 |
-0.062047 |
-0.093086 |
-0.057819 |
0.306167 |
0.702151 |
21.766667 |
True |
30.0 |
133.8 |
21.766667 |
0.0 |
0.0 |
0.0 |
1219 |
138 |
-0.059936 |
NaN |
NaN |
NaN |