| 2026-03-01 08:50:00+08:00 |
146 |
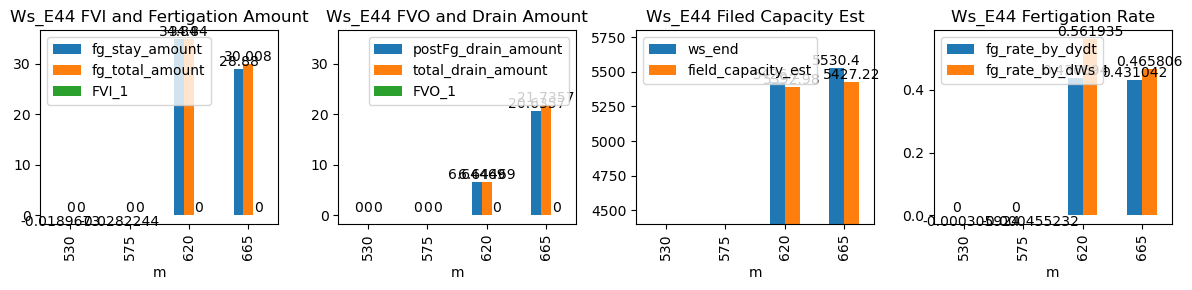
530 |
Ws_E44 |
0.615823 |
30 |
530.0 |
NaN |
531.03 |
NaN |
4879.0 |
NaN |
62 |
-0.018967 |
NaN |
-0.018967 |
NaN |
-0.000306 |
-0.018967 |
False |
NaN |
NaN |
NaN |
NaN |
NaN |
NaN |
NaN |
NaN |
NaN |
NaN |
NaN |
NaN |
| 2026-03-01 09:35:00+08:00 |
146 |
575 |
Ws_E44 |
0.615823 |
30 |
575.0 |
NaN |
576.03 |
NaN |
4879.0 |
NaN |
62 |
-0.028224 |
-0.027381 |
-0.028224 |
NaN |
-0.000455 |
-0.028224 |
False |
NaN |
NaN |
NaN |
NaN |
NaN |
NaN |
NaN |
NaN |
NaN |
NaN |
NaN |
NaN |
| 2026-03-01 10:20:00+08:00 |
146 |
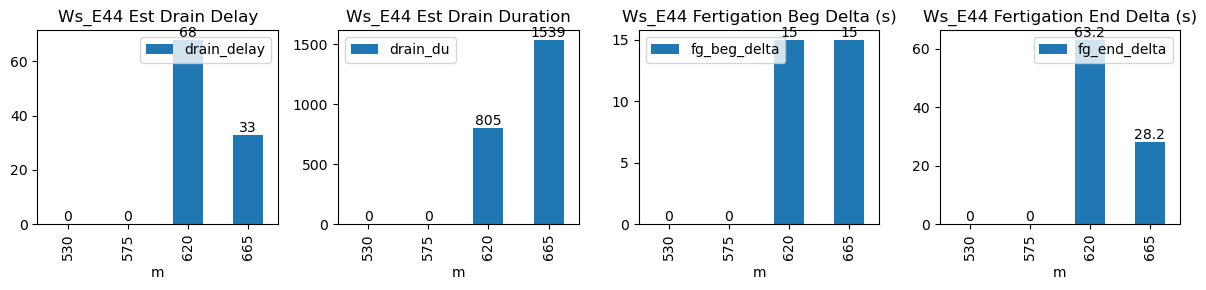
620 |
Ws_E44 |
0.615823 |
30 |
620.0 |
620.25 |
621.03 |
622.083333 |
5252.0 |
5426.2 |
62 |
-0.009665 |
-0.123961 |
-0.017469 |
0.436694 |
0.561935 |
34.840000 |
True |
15.0 |
63.2 |
34.840 |
0.0 |
6.644689 |
6.644689 |
805.0 |
68.0 |
-0.257243 |
5392.976554 |
NaN |
NaN |
| 2026-03-01 11:05:00+08:00 |
146 |
665 |
Ws_E44 |
0.615823 |
30 |
665.0 |
665.25 |
666.03 |
666.500000 |
5386.0 |
5530.4 |
62 |
-0.014856 |
-0.263432 |
-0.021514 |
0.431042 |
0.465806 |
28.880000 |
True |
15.0 |
28.2 |
30.008 |
1.1 |
20.635673 |
21.735673 |
1539.0 |
33.0 |
-0.367260 |
5427.221635 |
NaN |
NaN |