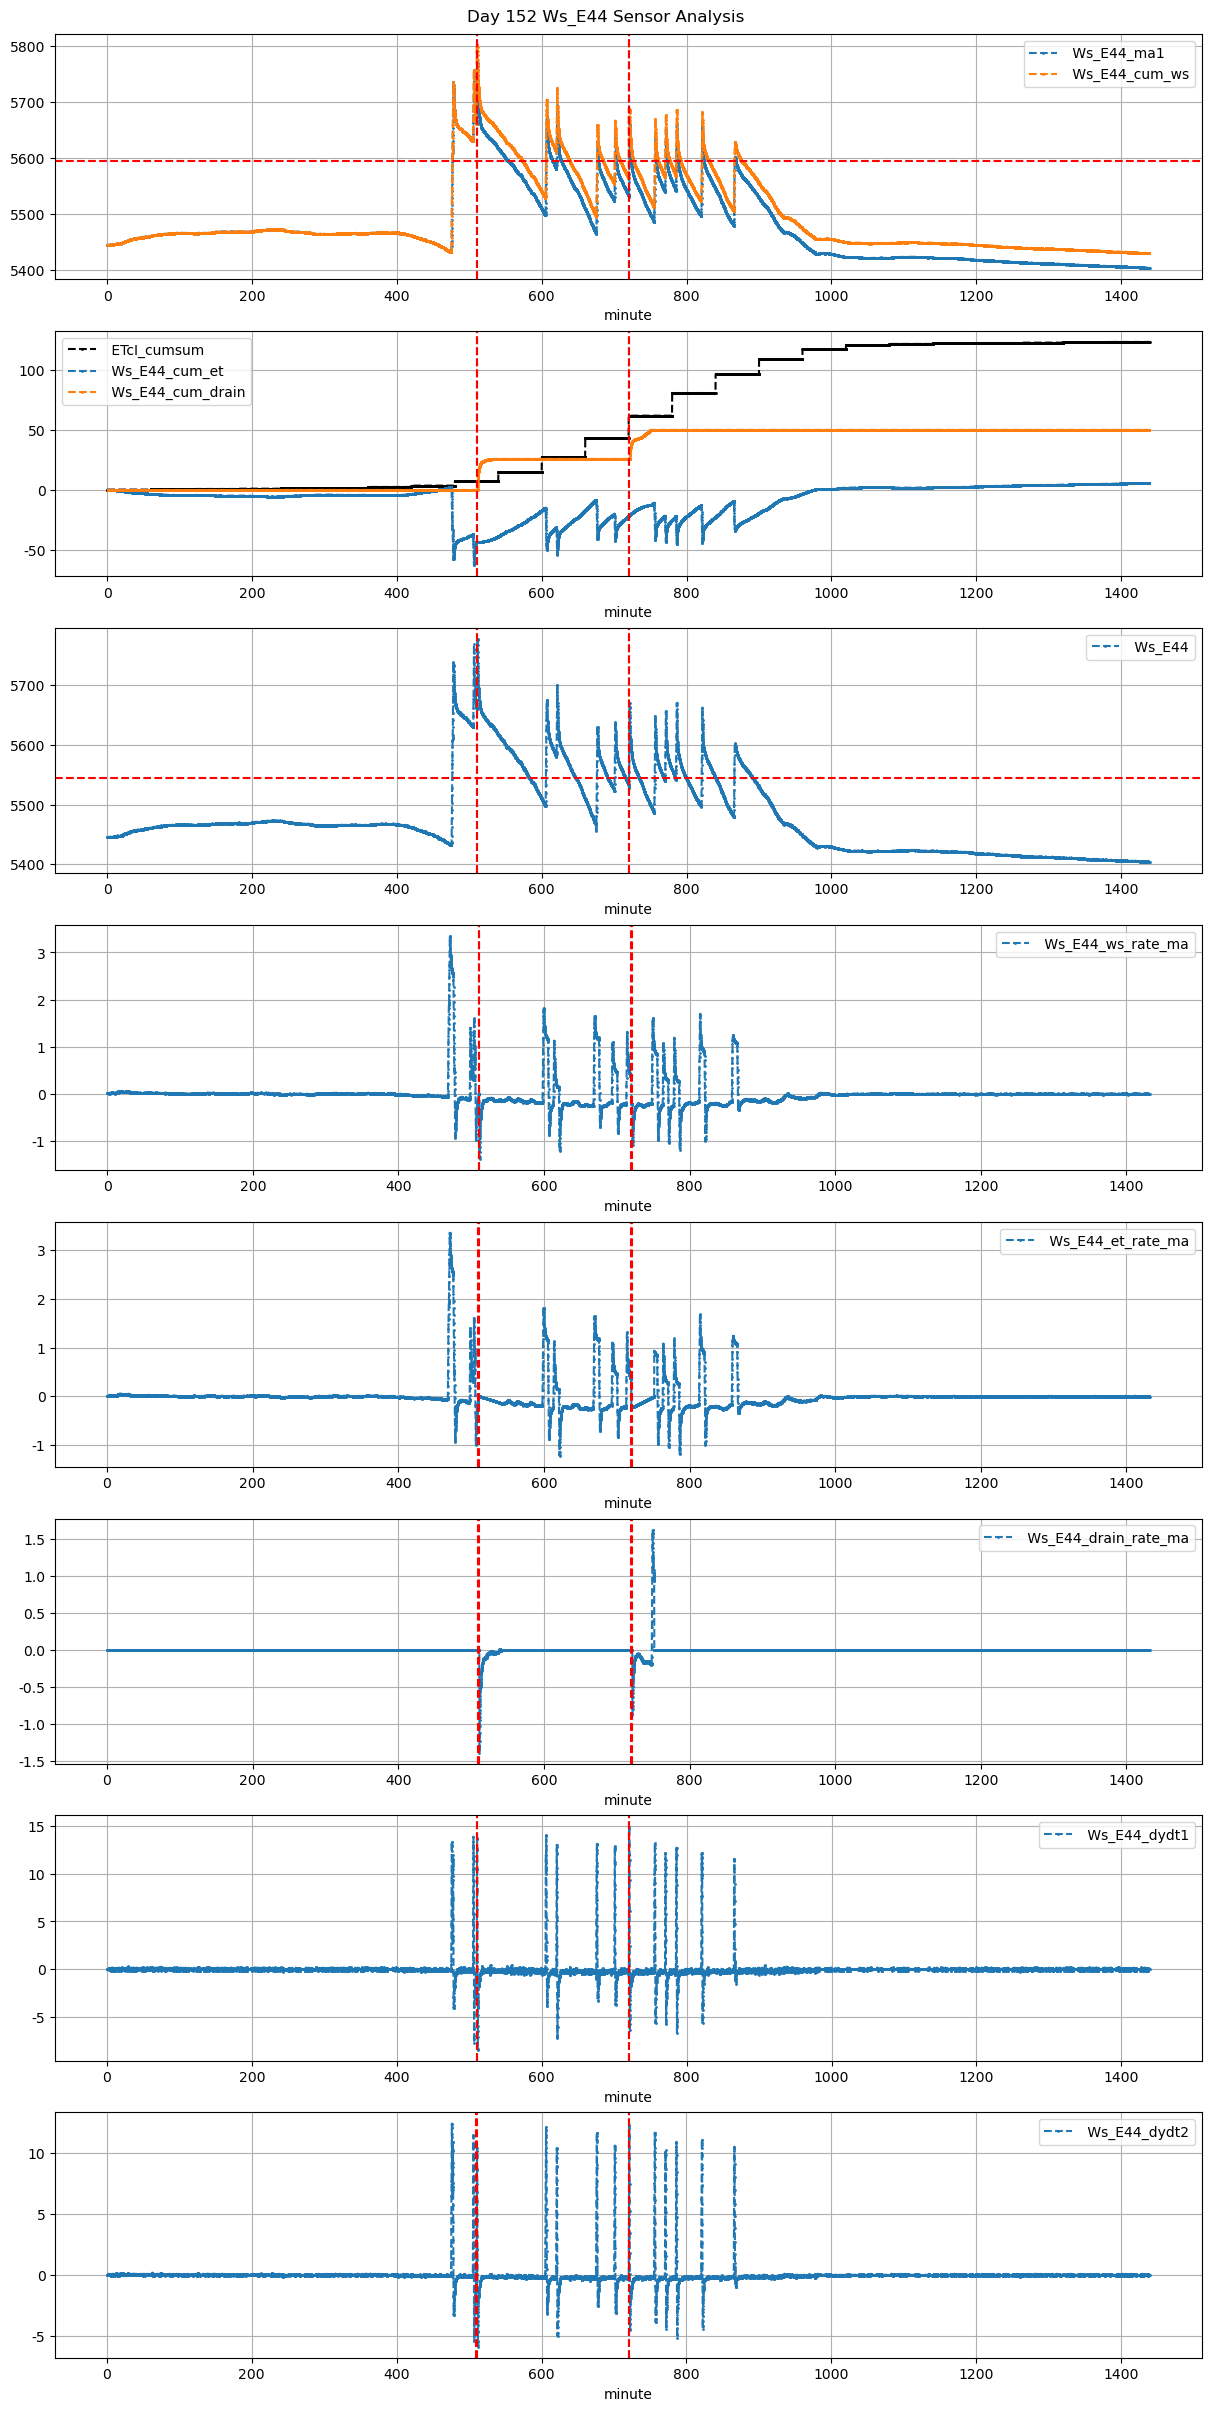
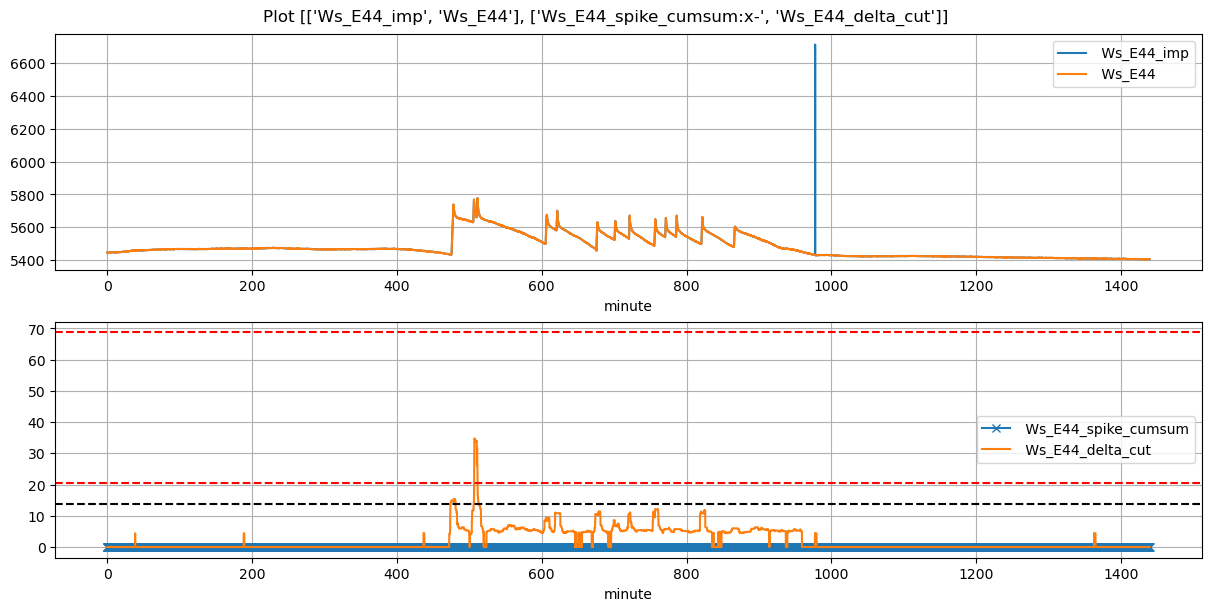
VI and VO Daily Summary
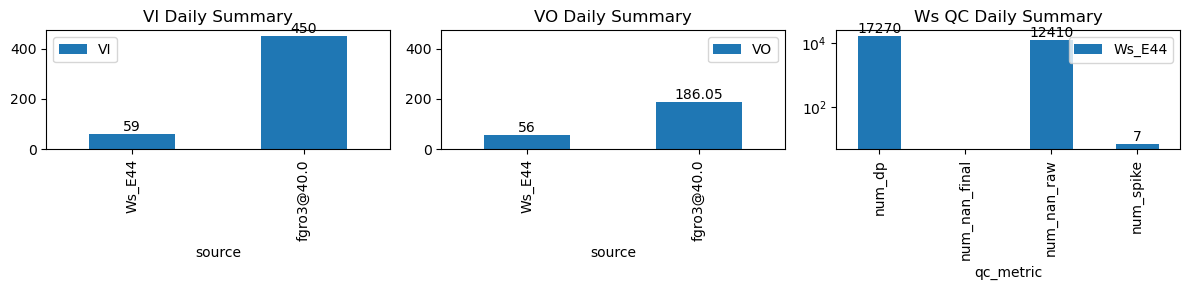
| ws_name | num_dp | num_nan_raw | num_nan_final | num_spike | cum_step_adj |
|---|---|---|---|---|---|
| Ws_E44 | 17,270 | 12,410 | 0 | 7 | 0.00 |
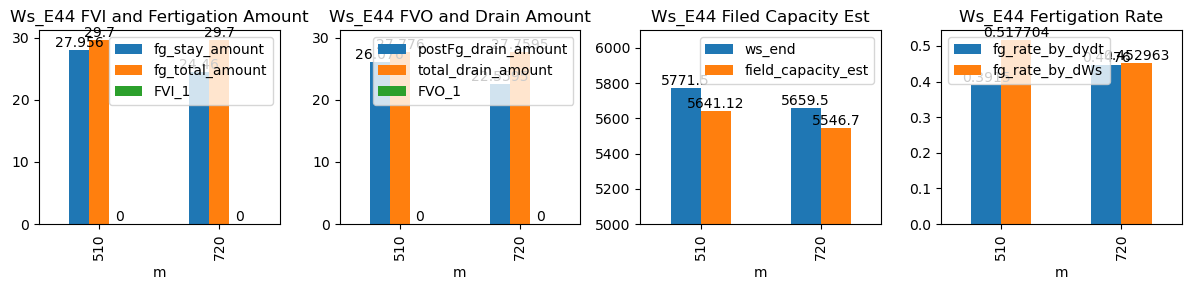
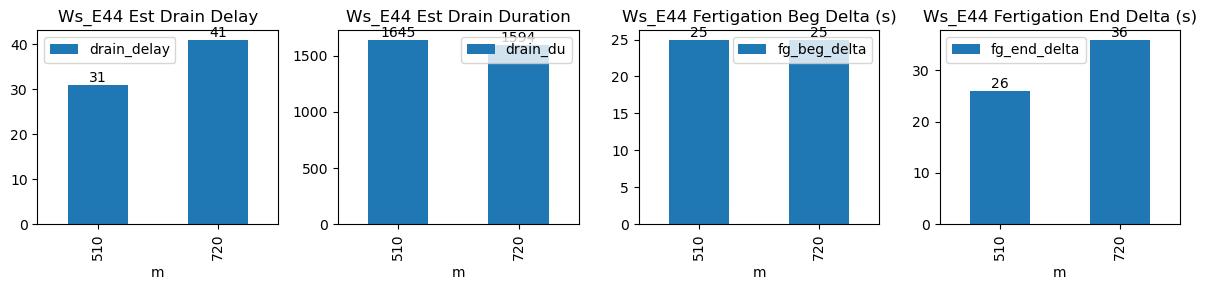
| ds | d | m | ws_name | prominence_cut | max_drain_du | fg_beg | fg_beg_est | fg_end | fg_end_est | ws_beg | ws_end | duc | pre_fg_et | post_fg_ws | post_drn_et | fg_rate_by_dydt | fg_rate_by_dWs | fg_stay_amount | enough_data | fg_beg_delta | fg_end_delta | fg_total_amount | fg_drain_amount | postFg_drain_amount | total_drain_amount | drain_du | drain_delay | drain_rate | field_capacity_est | FVI_1 | FVO_1 |
|---|---|---|---|---|---|---|---|---|---|---|---|---|---|---|---|---|---|---|---|---|---|---|---|---|---|---|---|---|---|---|---|
| 2026-03-07 08:30:00+08:00 | 152 | 510 | Ws_E44 | 1.81872 | 30 | 510.0 | 510.416667 | 510.9 | 511.333333 | 5631.72 | 5771.5 | 54 | 0.000000 | -0.366025 | -0.140689 | 0.3915 | 0.517704 | 27.956 | True | 25.0 | 26.0 | 29.7 | 1.7 | 26.076028 | 27.776028 | 1645 | 31 | -0.518307 | 5641.119859 | NaN | NaN |
| 2026-03-07 12:00:00+08:00 | 152 | 720 | Ws_E44 | 1.81872 | 30 | 720.0 | 720.416667 | 720.9 | 721.500000 | 5537.20 | 5659.5 | 54 | -0.226649 | -0.400185 | 0.000000 | 0.4476 | 0.452963 | 24.460 | True | 25.0 | 36.0 | 29.7 | 5.2 | 22.559530 | 27.759530 | 1594 | 41 | -0.328465 | 5546.702349 | NaN | NaN |