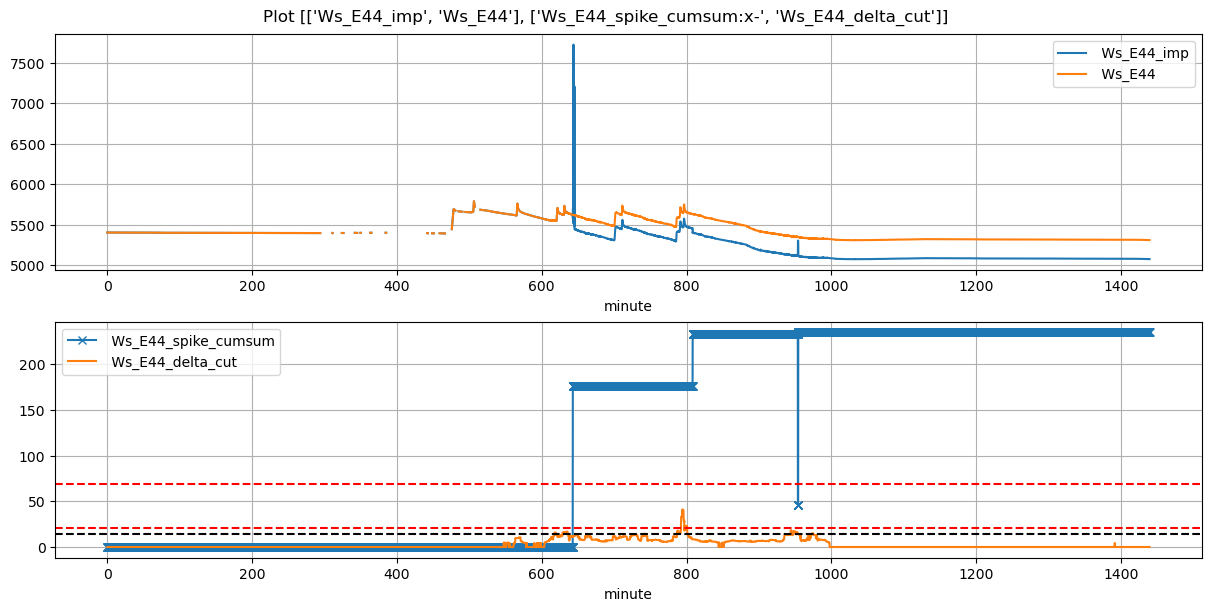
VI and VO Daily Summary
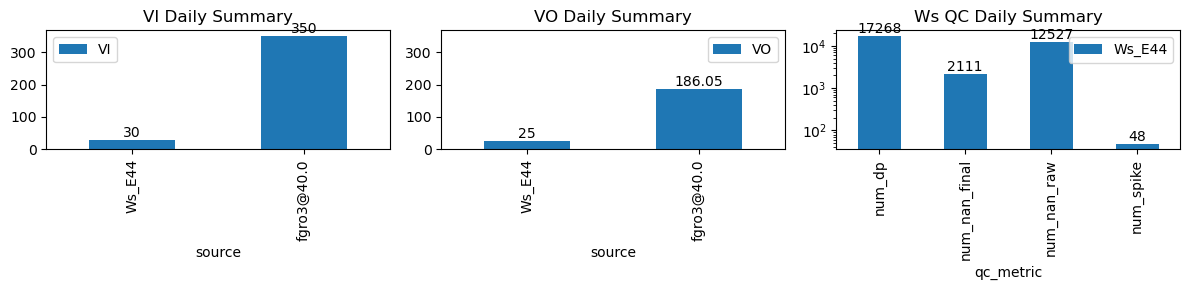
| ws_name | num_dp | num_nan_raw | num_nan_final | num_spike | cum_step_adj |
|---|---|---|---|---|---|
| Ws_E44 | 17,268 | 12,527 | 2,111 | 48 | 234.67 |
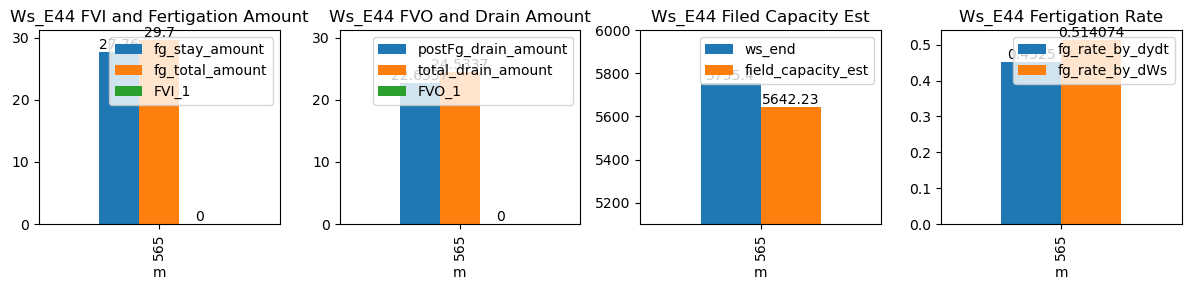
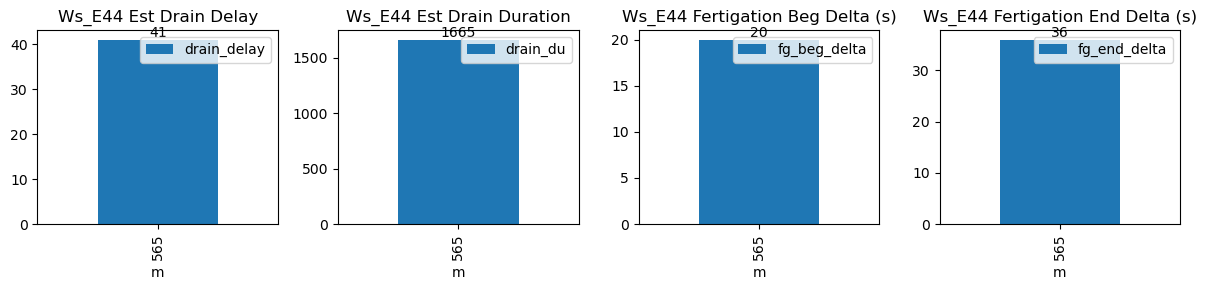
| ds | d | m | ws_name | prominence_cut | max_drain_du | fg_beg | fg_beg_est | fg_end | fg_end_est | ws_beg | ws_end | duc | pre_fg_et | post_fg_ws | post_drn_et | fg_rate_by_dydt | fg_rate_by_dWs | fg_stay_amount | enough_data | fg_beg_delta | fg_end_delta | fg_total_amount | fg_drain_amount | postFg_drain_amount | total_drain_amount | drain_du | drain_delay | drain_rate | field_capacity_est | FVI_1 | FVO_1 |
|---|---|---|---|---|---|---|---|---|---|---|---|---|---|---|---|---|---|---|---|---|---|---|---|---|---|---|---|---|---|---|---|
| 2026-03-08 09:25:00+08:00 | 153 | 565 | Ws_E44 | 1.568815 | 30 | 565.0 | 565.333333 | 565.9 | 566.5 | 5616.6 | 5755.4 | 54 | -0.109222 | -0.434418 | -0.187838 | 0.4525 | 0.514074 | 27.76 | True | 20.0 | 36.0 | 29.7 | 1.9 | 22.633727 | 24.533727 | 1665 | 41 | -0.416357 | 5642.231364 | NaN | NaN |