VI and VO Daily Summary
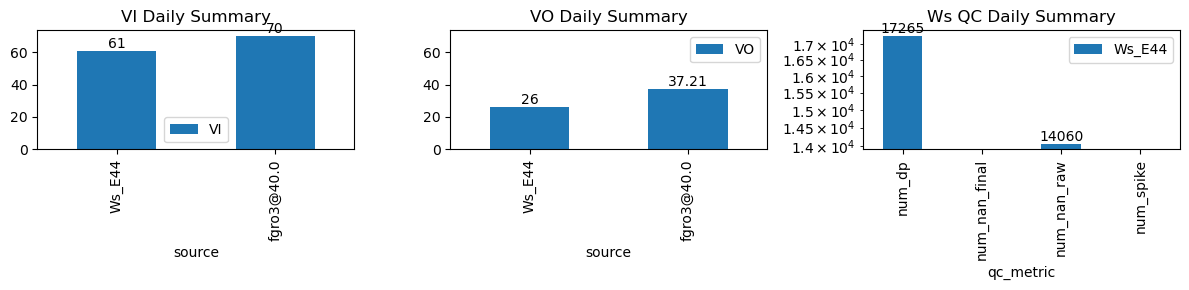
| ws_name | num_dp | num_nan_raw | num_nan_final | num_spike | cum_step_adj |
|---|---|---|---|---|---|
| Ws_E44 | 17,265 | 14,060 | 0 | 0 | 0.00 |
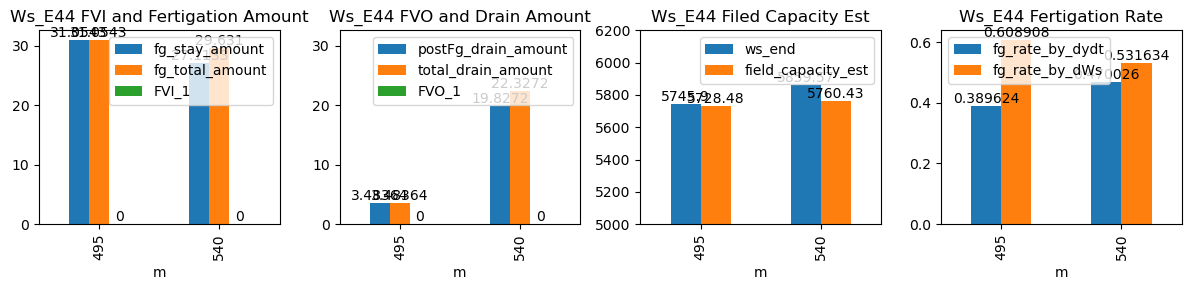
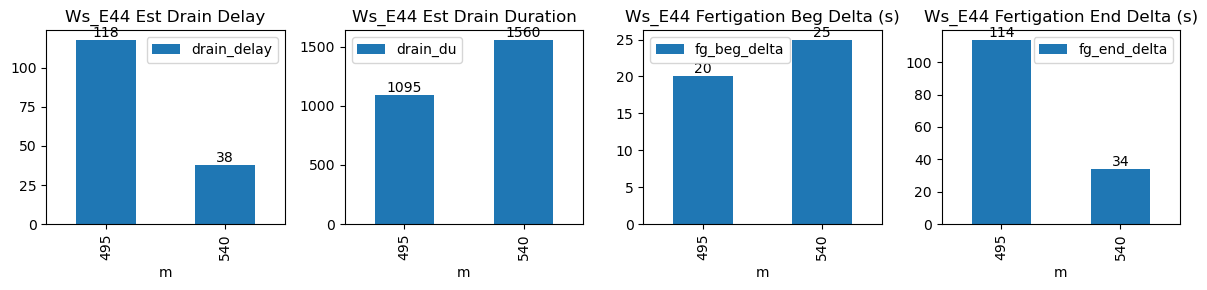
| ds | d | m | ws_name | prominence_cut | max_drain_du | fg_beg | fg_beg_est | fg_end | fg_end_est | ws_beg | ws_end | duc | pre_fg_et | post_fg_ws | post_drn_et | fg_rate_by_dydt | fg_rate_by_dWs | fg_stay_amount | enough_data | fg_beg_delta | fg_end_delta | fg_total_amount | fg_drain_amount | postFg_drain_amount | total_drain_amount | drain_du | drain_delay | drain_rate | field_capacity_est | FVI_1 | FVO_1 |
|---|---|---|---|---|---|---|---|---|---|---|---|---|---|---|---|---|---|---|---|---|---|---|---|---|---|---|---|---|---|---|---|
| 2026-03-18 08:15:00+08:00 | 163 | 495 | Ws_E44 | 0.58163 | 30 | 495.0 | 495.333333 | 495.85 | 497.750000 | 5590.628571 | 5745.900000 | 51 | -0.007510 | -0.080730 | -0.010267 | 0.389624 | 0.608908 | 31.054286 | True | 20.0 | 114.0 | 31.054286 | 0.0 | 3.483645 | 3.483645 | 1095 | 118 | -0.115547 | 5728.481777 | NaN | NaN |
| 2026-03-18 09:00:00+08:00 | 163 | 540 | Ws_E44 | 0.58163 | 30 | 540.0 | 540.416667 | 540.85 | 541.416667 | 5724.000000 | 5859.566667 | 51 | -0.009867 | -0.260504 | -0.022675 | 0.470026 | 0.531634 | 27.113333 | True | 25.0 | 34.0 | 29.631000 | 2.5 | 19.827240 | 22.327240 | 1560 | 38 | -0.355240 | 5760.430466 | NaN | NaN |