VI and VO Daily Summary
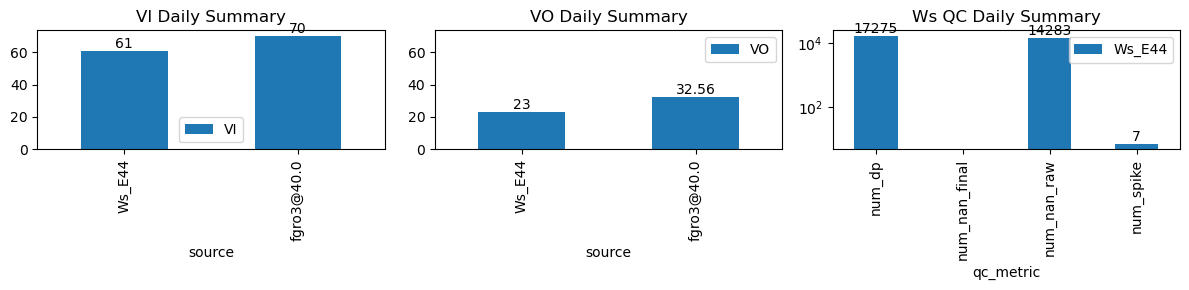
| ws_name | num_dp | num_nan_raw | num_nan_final | num_spike | cum_step_adj |
|---|---|---|---|---|---|
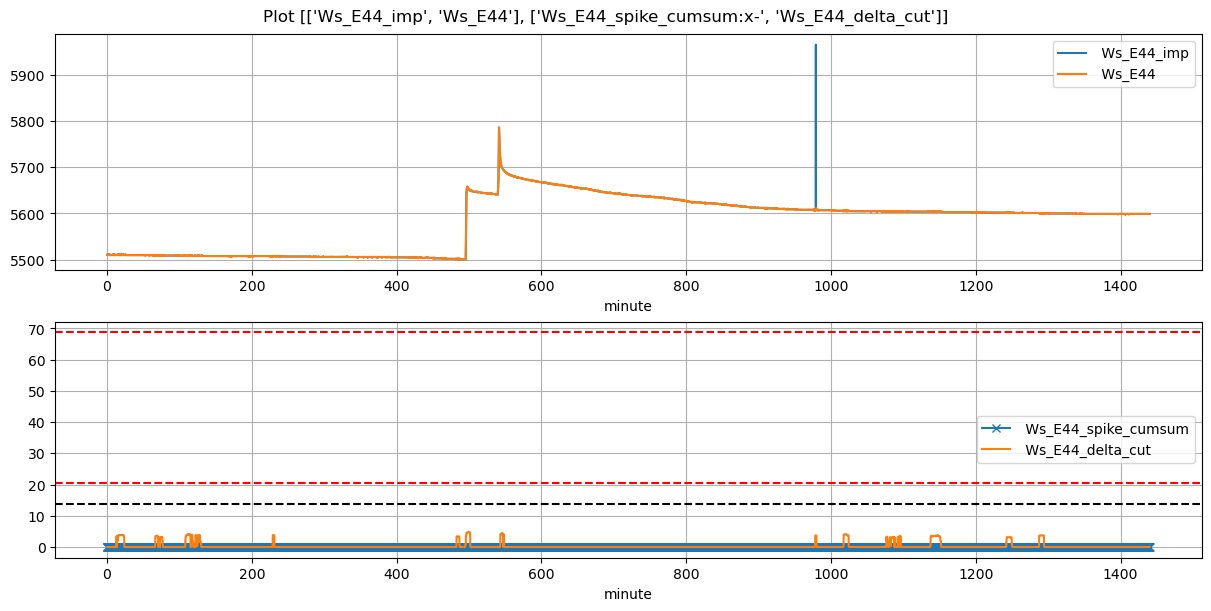
| Ws_E44 | 17,275 | 14,283 | 0 | 7 | 0.00 |
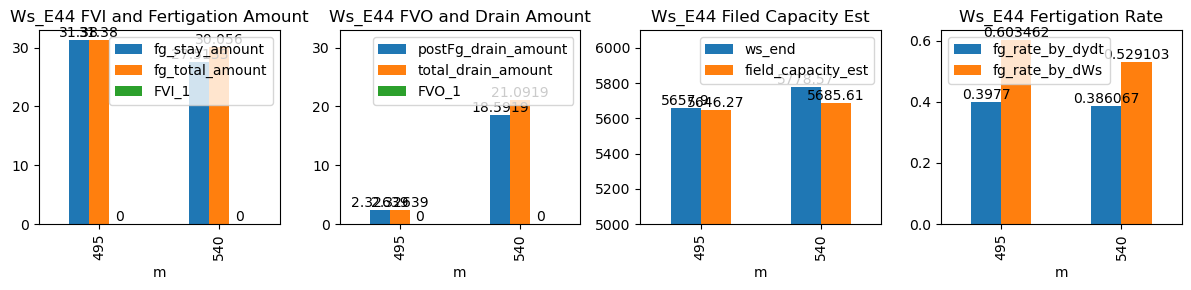
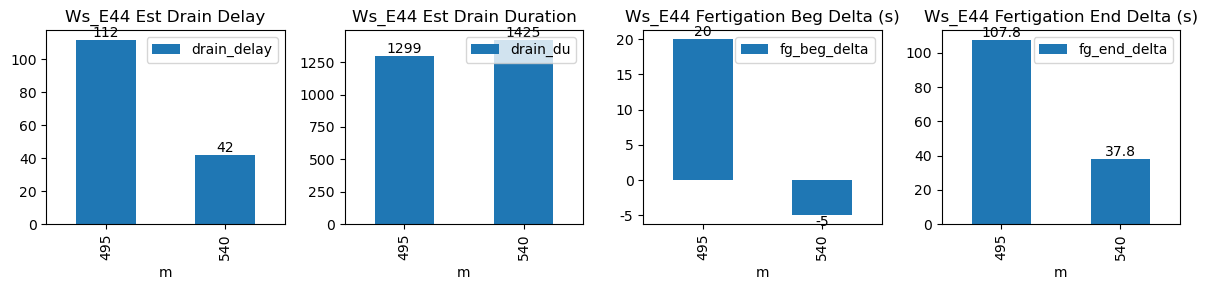
| ds | d | m | ws_name | prominence_cut | max_drain_du | fg_beg | fg_beg_est | fg_end | fg_end_est | ws_beg | ws_end | duc | pre_fg_et | post_fg_ws | post_drn_et | fg_rate_by_dydt | fg_rate_by_dWs | fg_stay_amount | enough_data | fg_beg_delta | fg_end_delta | fg_total_amount | fg_drain_amount | postFg_drain_amount | total_drain_amount | drain_du | drain_delay | drain_rate | field_capacity_est | FVI_1 | FVO_1 |
|---|---|---|---|---|---|---|---|---|---|---|---|---|---|---|---|---|---|---|---|---|---|---|---|---|---|---|---|---|---|---|---|
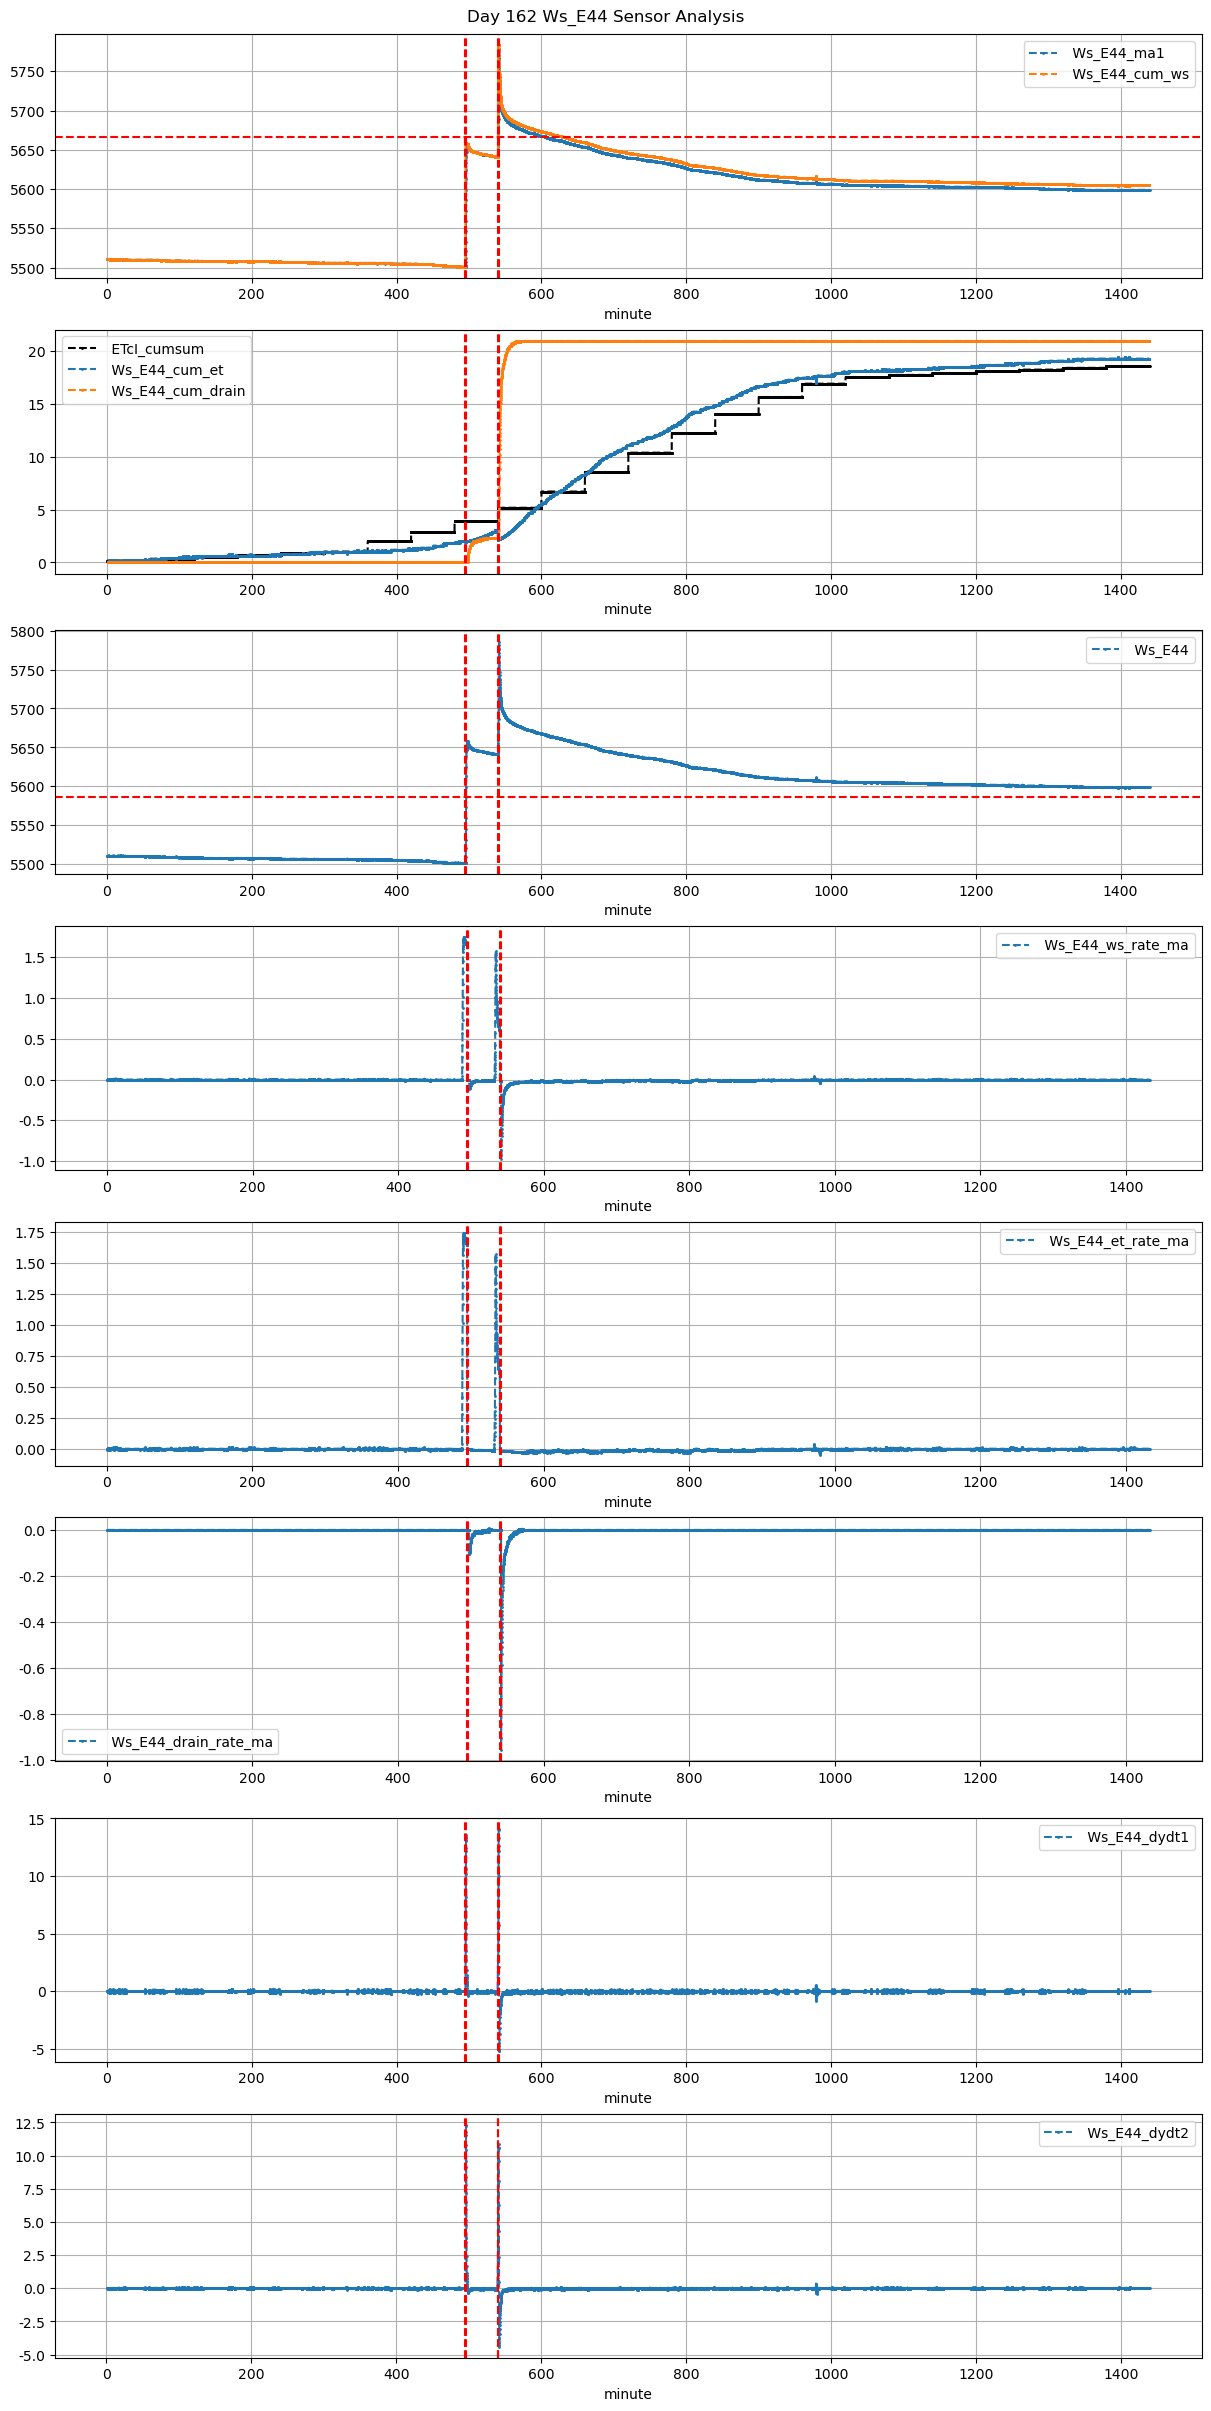
| 2026-03-17 08:15:00+08:00 | 162 | 495 | Ws_E44 | 0.535288 | 30 | 495.0 | 495.333333 | 495.87 | 497.666667 | 5501.0 | 5657.900000 | 52 | -0.005989 | -0.048436 | -0.013261 | 0.397700 | 0.603462 | 31.380000 | True | 20.0 | 107.8 | 31.380 | 0.0 | 2.326392 | 2.326392 | 1299 | 112 | -0.069906 | 5646.268038 | NaN | NaN |
| 2026-03-17 09:00:00+08:00 | 162 | 540 | Ws_E44 | 0.535288 | 30 | 540.0 | 539.916667 | 540.87 | 541.500000 | 5641.0 | 5778.566667 | 52 | -0.014718 | -0.255772 | -0.031245 | 0.386067 | 0.529103 | 27.513333 | True | -5.0 | 37.8 | 30.056 | 2.5 | 18.591936 | 21.091936 | 1425 | 42 | -0.361523 | 5685.606988 | NaN | NaN |