VI and VO Daily Summary
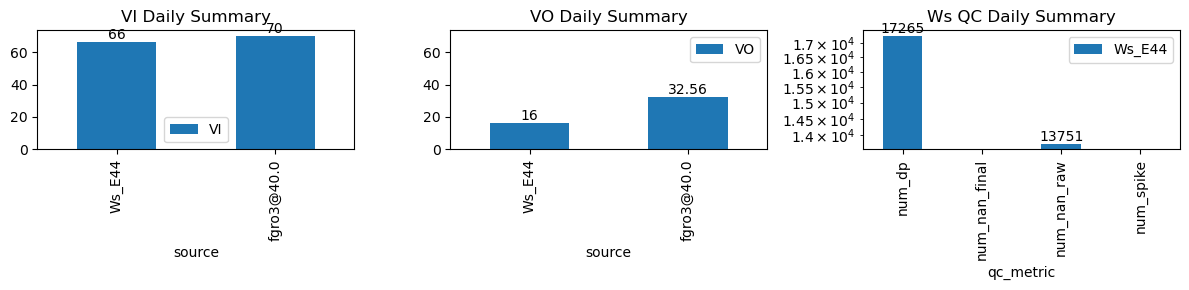
| ws_name | num_dp | num_nan_raw | num_nan_final | num_spike | cum_step_adj |
|---|---|---|---|---|---|
| Ws_E44 | 17,265 | 13,751 | 0 | 0 | 0.00 |
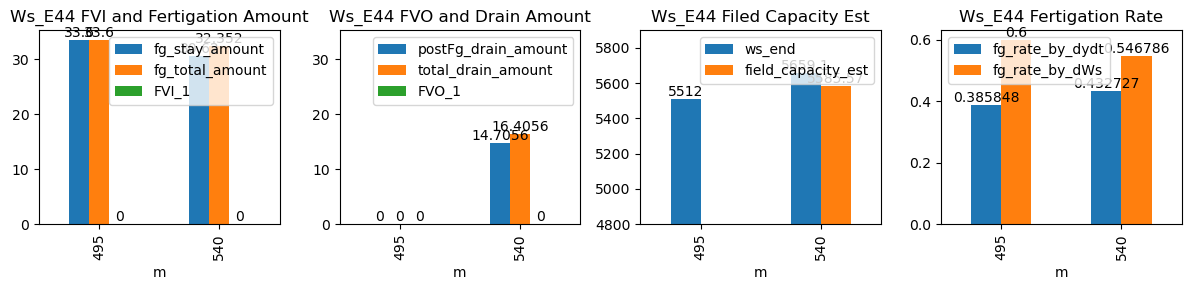
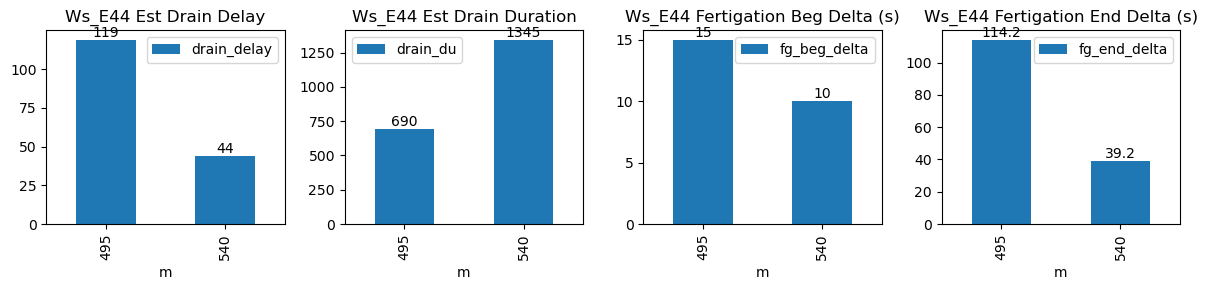
| ds | d | m | ws_name | prominence_cut | max_drain_du | fg_beg | fg_beg_est | fg_end | fg_end_est | ws_beg | ws_end | duc | pre_fg_et | post_fg_ws | post_drn_et | fg_rate_by_dydt | fg_rate_by_dWs | fg_stay_amount | enough_data | fg_beg_delta | fg_end_delta | fg_total_amount | fg_drain_amount | postFg_drain_amount | total_drain_amount | drain_du | drain_delay | drain_rate | field_capacity_est | FVI_1 | FVO_1 |
|---|---|---|---|---|---|---|---|---|---|---|---|---|---|---|---|---|---|---|---|---|---|---|---|---|---|---|---|---|---|---|---|
| 2026-03-16 08:15:00+08:00 | 161 | 495 | Ws_E44 | 0.408554 | 30 | 495.0 | 495.250000 | 495.93 | 497.833333 | 5344.0 | 5512.0 | 56 | -0.005774 | -0.019444 | -0.011363 | 0.385848 | 0.600000 | 33.60 | True | 15.0 | 114.2 | 33.600 | 0.0 | 0.000000 | 0.000000 | 690 | 119 | -0.016384 | NaN | NaN | NaN |
| 2026-03-16 09:00:00+08:00 | 161 | 540 | Ws_E44 | 0.408554 | 30 | 540.0 | 540.166667 | 540.93 | 541.583333 | 5506.0 | 5659.1 | 56 | -0.011454 | -0.213236 | -0.028344 | 0.432727 | 0.546786 | 30.62 | True | 10.0 | 39.2 | 32.352 | 1.7 | 14.705565 | 16.405565 | 1345 | 44 | -0.346262 | 5585.572175 | NaN | NaN |