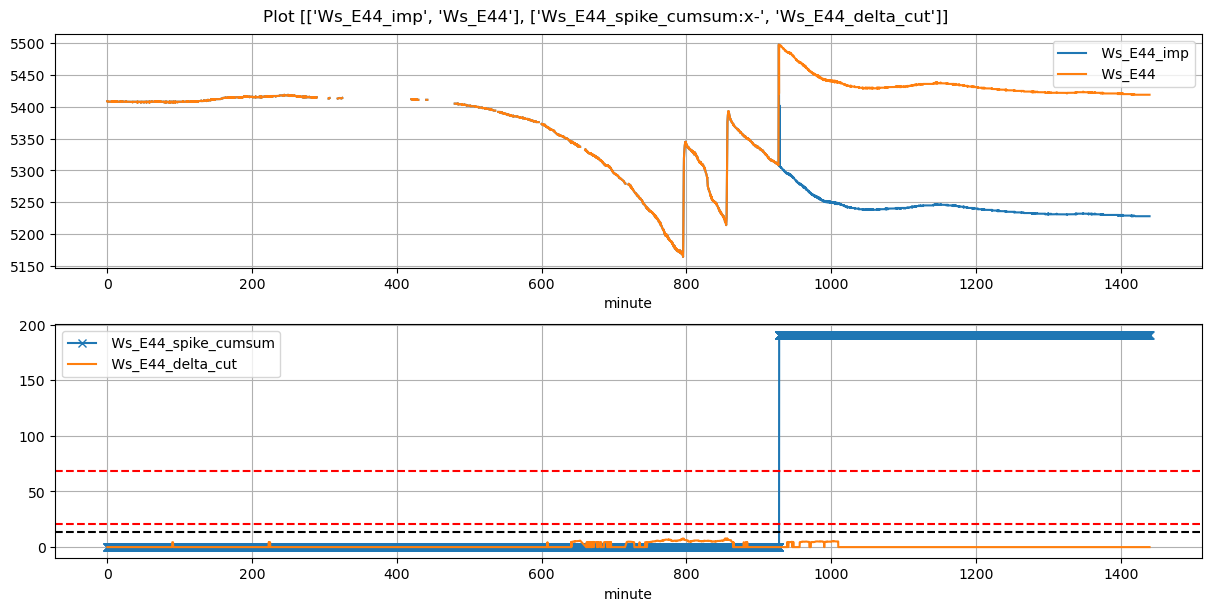
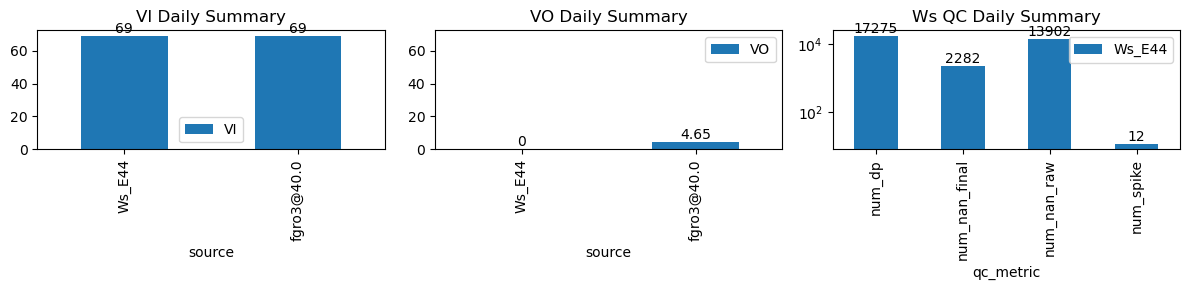
VI and VO Daily Summary
| ws_name | num_dp | num_nan_raw | num_nan_final | num_spike | cum_step_adj |
|---|---|---|---|---|---|
| Ws_E44 | 17,275 | 13,902 | 2,282 | 12 | 191.00 |
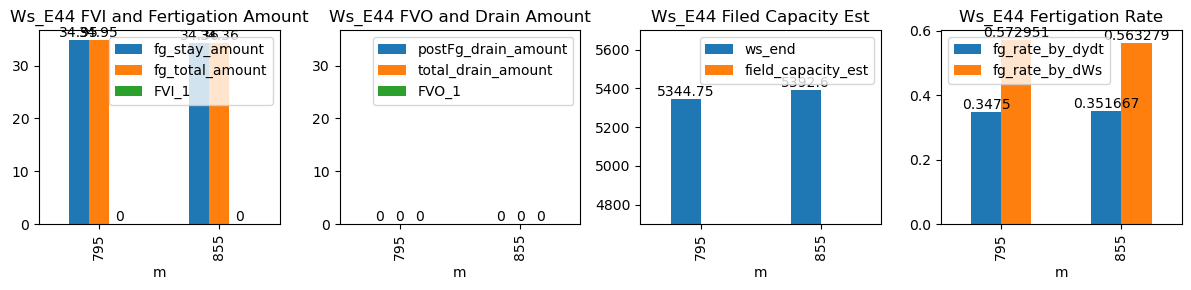
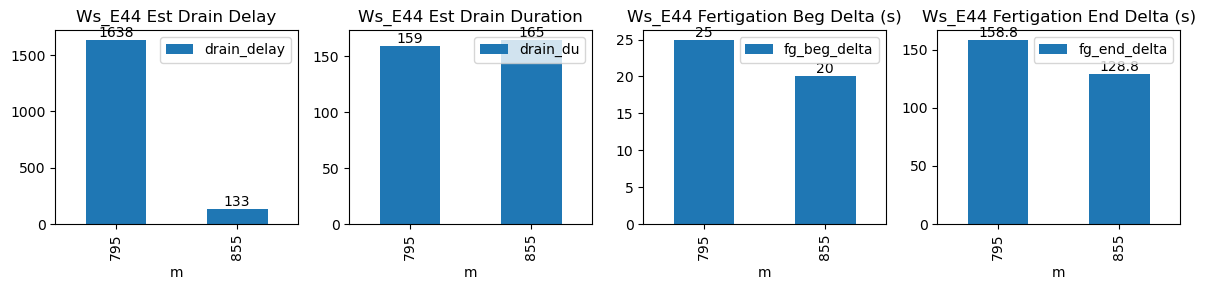
| ds | d | m | ws_name | prominence_cut | max_drain_du | fg_beg | fg_beg_est | fg_end | fg_end_est | ws_beg | ws_end | duc | pre_fg_et | post_fg_ws | post_drn_et | fg_rate_by_dydt | fg_rate_by_dWs | fg_stay_amount | enough_data | fg_beg_delta | fg_end_delta | fg_total_amount | fg_drain_amount | postFg_drain_amount | total_drain_amount | drain_du | drain_delay | drain_rate | field_capacity_est | FVI_1 | FVO_1 |
|---|---|---|---|---|---|---|---|---|---|---|---|---|---|---|---|---|---|---|---|---|---|---|---|---|---|---|---|---|---|---|---|
| 2026-03-04 13:15:00+08:00 | 149 | 795 | Ws_E44 | 0.354111 | 30 | 795.0 | 795.416667 | 796.02 | 798.666667 | 5170.0 | 5344.75 | 61 | -0.088233 | -0.096926 | -0.405560 | 0.347500 | 0.572951 | 34.95 | True | 25.0 | 158.8 | 34.95 | 0.0 | 0 | 0.0 | 159 | 1638 | -0.075158 | NaN | NaN | NaN |
| 2026-03-04 14:15:00+08:00 | 149 | 855 | Ws_E44 | 0.354111 | 30 | 855.0 | 855.333333 | 856.02 | 858.166667 | 5220.8 | 5392.60 | 61 | -0.177341 | -0.149966 | -0.085926 | 0.351667 | 0.563279 | 34.36 | True | 20.0 | 128.8 | 34.36 | 0.0 | 0 | 0.0 | 165 | 133 | -0.090293 | NaN | NaN | NaN |