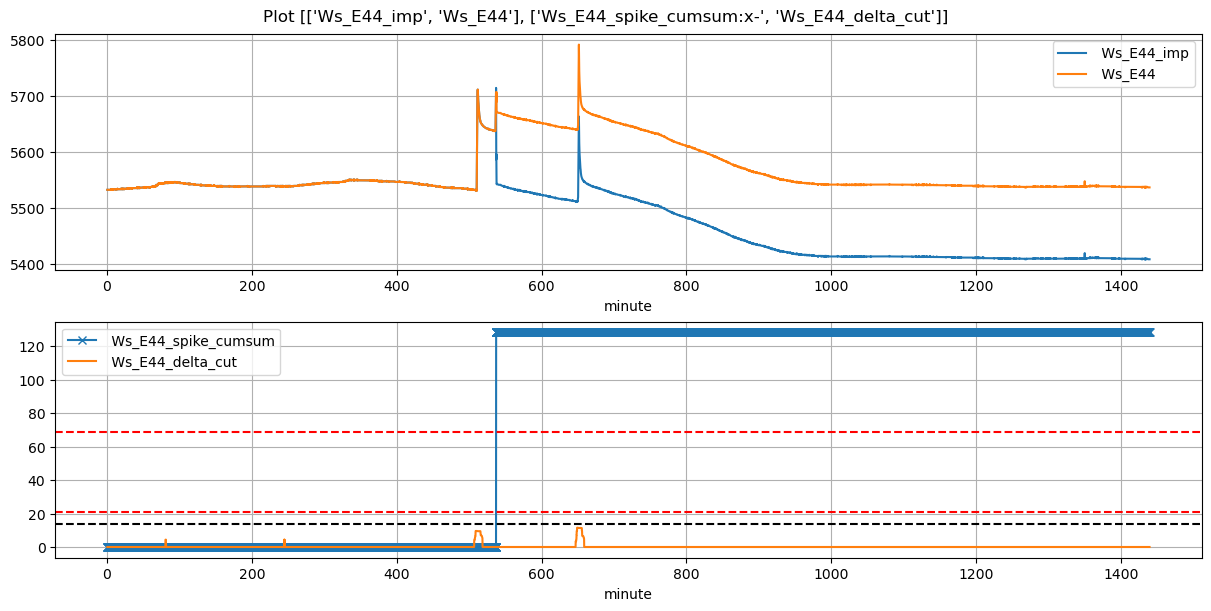
VI and VO Daily Summary
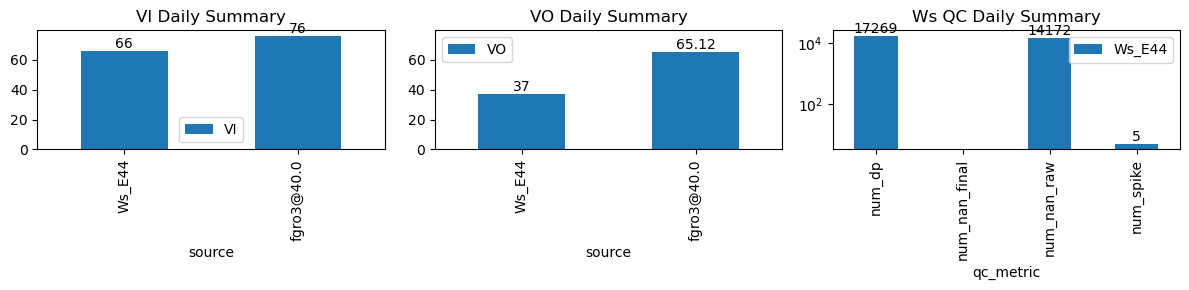
| ws_name | num_dp | num_nan_raw | num_nan_final | num_spike | cum_step_adj |
|---|---|---|---|---|---|
| Ws_E44 | 17,269 | 14,172 | 0 | 5 | 128.33 |
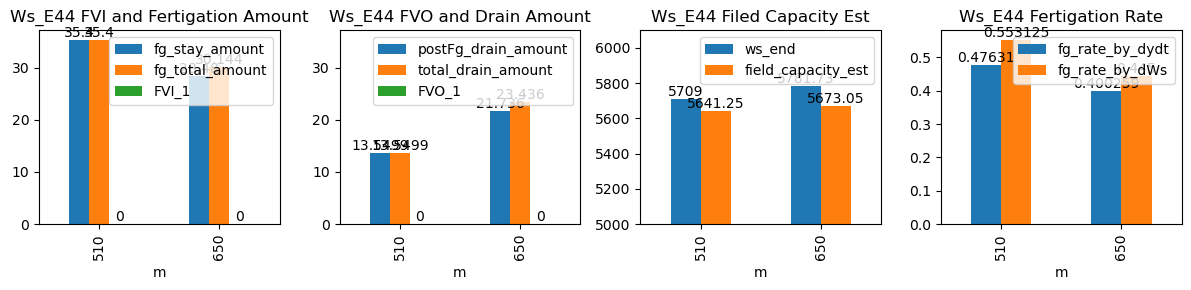
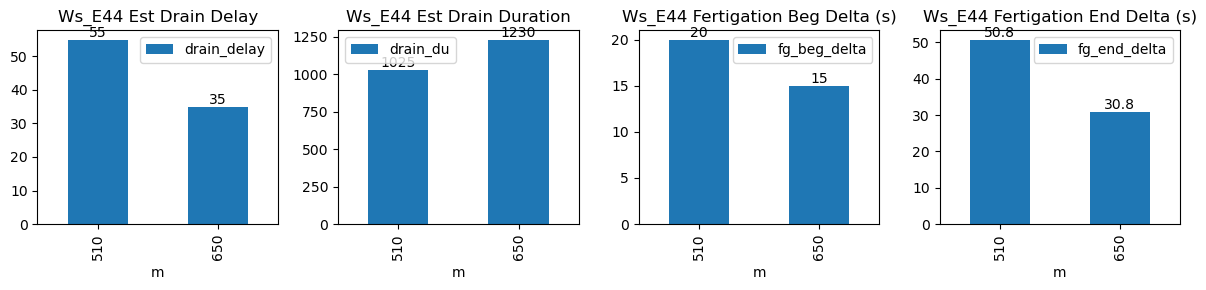
| ds | d | m | ws_name | prominence_cut | max_drain_du | fg_beg | fg_beg_est | fg_end | fg_end_est | ws_beg | ws_end | duc | pre_fg_et | post_fg_ws | post_drn_et | fg_rate_by_dydt | fg_rate_by_dWs | fg_stay_amount | enough_data | fg_beg_delta | fg_end_delta | fg_total_amount | fg_drain_amount | postFg_drain_amount | total_drain_amount | drain_du | drain_delay | drain_rate | field_capacity_est | FVI_1 | FVO_1 |
|---|---|---|---|---|---|---|---|---|---|---|---|---|---|---|---|---|---|---|---|---|---|---|---|---|---|---|---|---|---|---|---|
| 2026-03-03 08:30:00+08:00 | 148 | 510 | Ws_E44 | 0.743539 | 30 | 510.0 | 510.333333 | 511.07 | 511.916667 | 5532.000000 | 5709.000000 | 64 | -0.013969 | -0.217289 | 0.000000 | 0.476310 | 0.553125 | 35.40 | True | 20.0 | 50.8 | 35.400 | 0.0 | 13.549936 | 13.549936 | 1025 | 55 | -0.416007 | 5641.250321 | NaN | NaN |
| 2026-03-03 10:50:00+08:00 | 148 | 650 | Ws_E44 | 0.743539 | 30 | 650.0 | 650.250000 | 651.07 | 651.583333 | 5639.333333 | 5781.733333 | 64 | -0.017239 | -0.269568 | -0.035549 | 0.400259 | 0.445000 | 28.48 | True | 15.0 | 30.8 | 30.144 | 1.7 | 21.735968 | 23.435968 | 1230 | 35 | -0.419402 | 5673.053491 | NaN | NaN |