| 2026-03-20 08:10:00+08:00 |
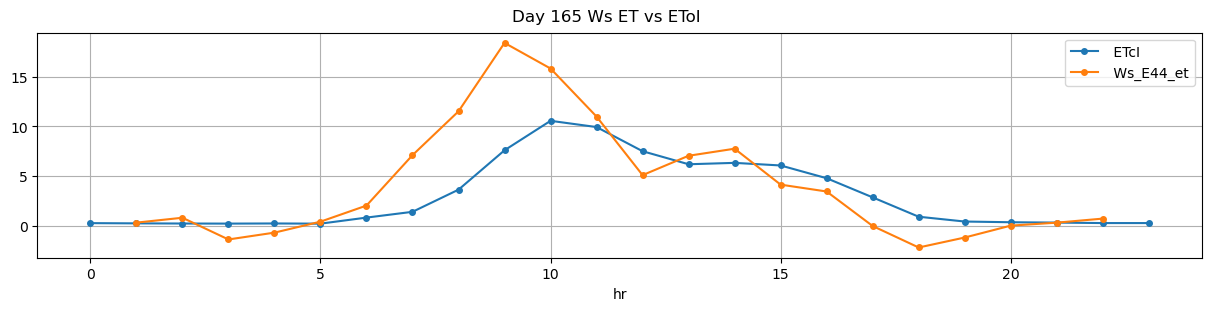
165 |
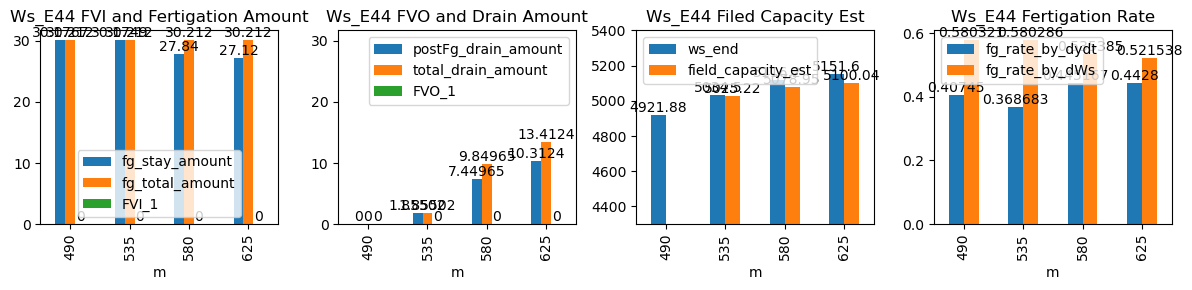
490 |
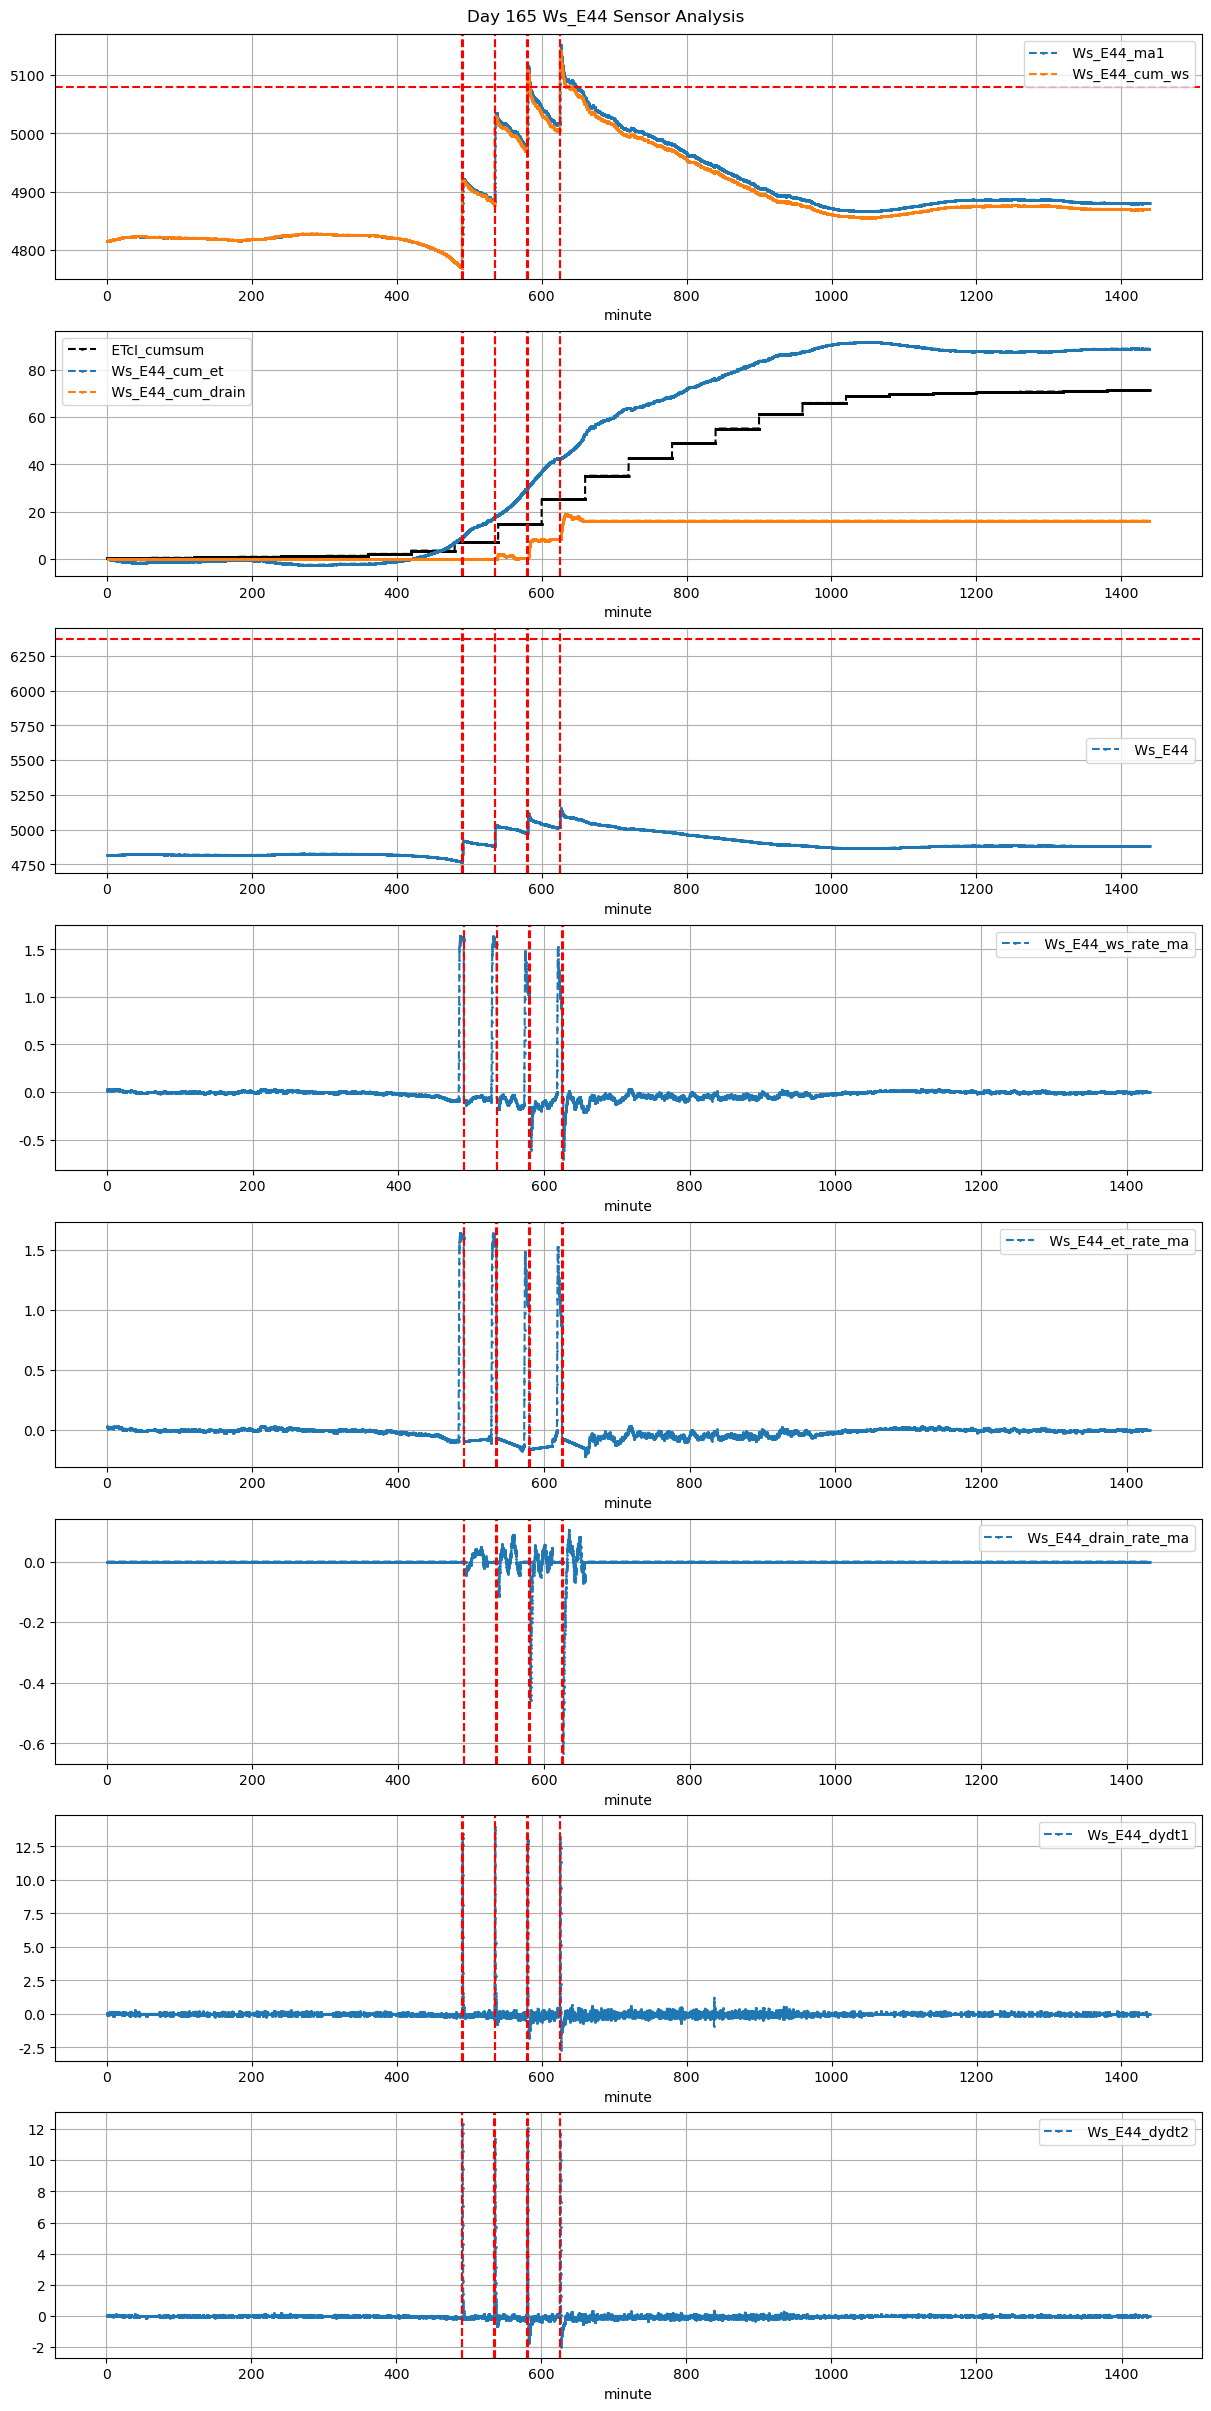
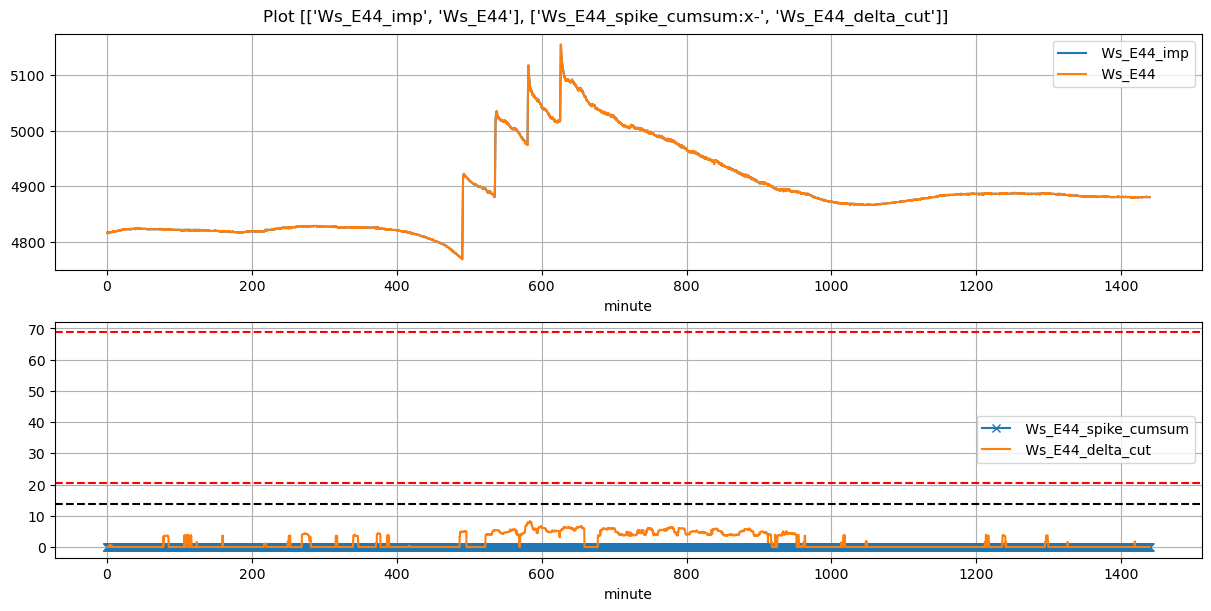
Ws_E44 |
0.508519 |
30 |
490.0 |
490.416667 |
490.87 |
492.583333 |
4771.000000 |
4921.883333 |
52 |
-0.088702 |
-0.106317 |
-0.072555 |
0.407450 |
0.580321 |
30.176667 |
True |
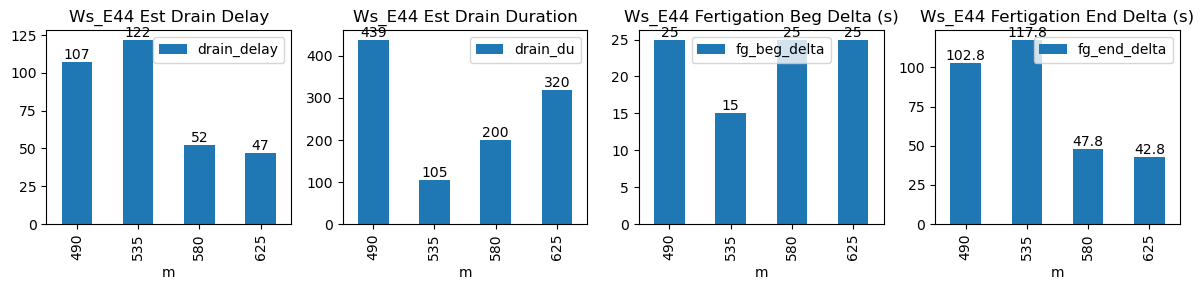
25.0 |
102.8 |
30.212 |
0.0 |
0.000000 |
0.000000 |
439 |
107 |
-0.036123 |
NaN |
NaN |
NaN |
| 2026-03-20 08:55:00+08:00 |
165 |
535 |
Ws_E44 |
0.508519 |
30 |
535.0 |
535.250000 |
535.87 |
537.833333 |
4883.625714 |
5034.500000 |
52 |
-0.069351 |
-0.073390 |
-0.139156 |
0.368683 |
0.580286 |
30.174857 |
True |
15.0 |
117.8 |
30.212 |
0.0 |
1.855018 |
1.855018 |
105 |
122 |
-0.097362 |
5025.224912 |
NaN |
NaN |
| 2026-03-20 09:40:00+08:00 |
165 |
580 |
Ws_E44 |
0.508519 |
30 |
580.0 |
580.416667 |
580.87 |
581.666667 |
4977.000000 |
5116.200000 |
52 |
-0.156015 |
-0.236681 |
-0.130350 |
0.445167 |
0.535385 |
27.840000 |
True |
25.0 |
47.8 |
30.212 |
2.4 |
7.449651 |
9.849651 |
200 |
52 |
-0.291893 |
5078.951743 |
NaN |
NaN |
| 2026-03-20 10:25:00+08:00 |
165 |
625 |
Ws_E44 |
0.508519 |
30 |
625.0 |
625.416667 |
625.87 |
626.583333 |
5016.000000 |
5151.600000 |
52 |
-0.072618 |
-0.218025 |
-0.150922 |
0.442800 |
0.521538 |
27.120000 |
True |
25.0 |
42.8 |
30.212 |
3.1 |
10.312399 |
13.412399 |
320 |
47 |
-0.415697 |
5100.038004 |
NaN |
NaN |