| 2026-03-25 08:06:36+08:00 |
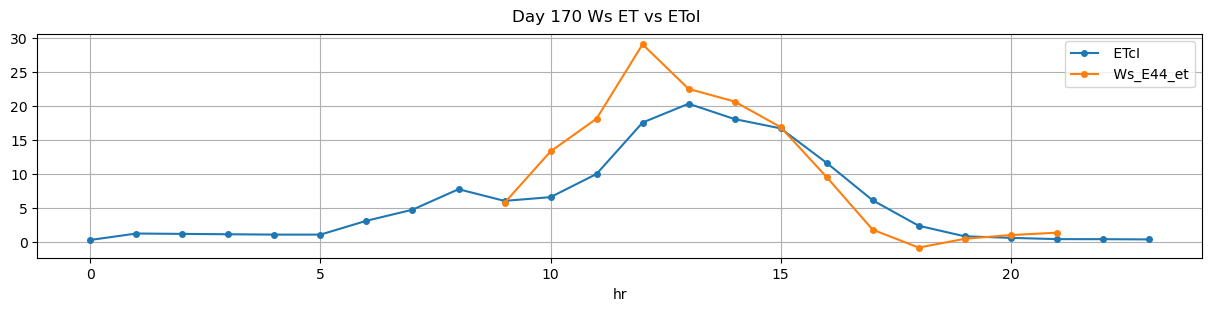
170 |
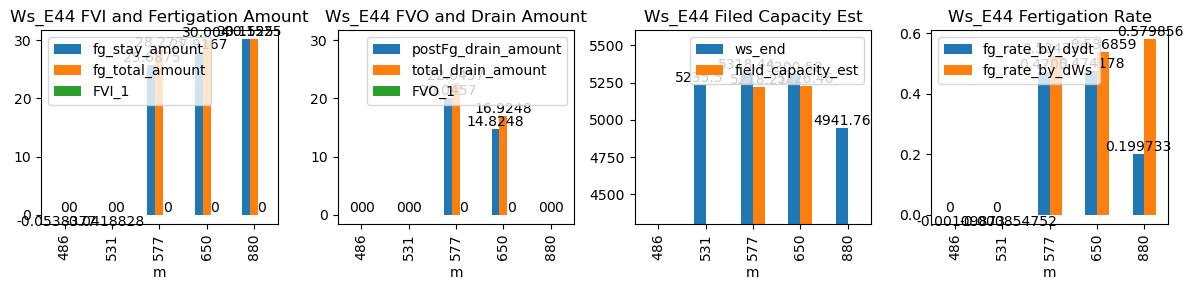
486 |
Ws_E44 |
1.380102 |
30 |
486.60 |
NaN |
487.42 |
NaN |
NaN |
NaN |
49 |
-0.053838 |
NaN |
-0.053838 |
NaN |
-0.001099 |
-0.053838 |
False |
NaN |
NaN |
NaN |
NaN |
NaN |
NaN |
NaN |
NaN |
NaN |
NaN |
NaN |
NaN |
| 2026-03-25 08:51:36+08:00 |
170 |
531 |
Ws_E44 |
1.380102 |
30 |
531.60 |
NaN |
532.42 |
535.416667 |
NaN |
5235.500000 |
49 |
-0.041883 |
-0.136502 |
-0.041883 |
NaN |
-0.000855 |
-0.041883 |
False |
NaN |
179.8 |
NaN |
NaN |
NaN |
NaN |
NaN |
NaN |
NaN |
NaN |
NaN |
NaN |
| 2026-03-25 09:37:55+08:00 |
170 |
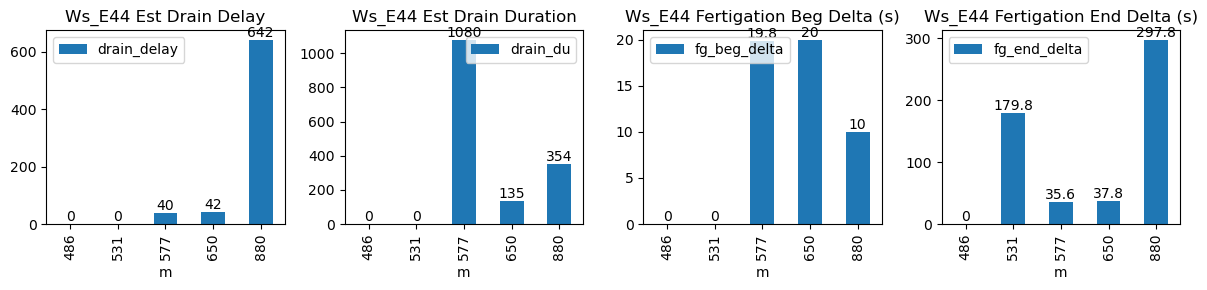
577 |
Ws_E44 |
1.380102 |
30 |
577.92 |
578.250000 |
578.74 |
579.333333 |
5190.0 |
5318.437500 |
49 |
-0.020000 |
-0.238632 |
-0.074994 |
0.470500 |
0.524235 |
25.687500 |
True |
19.8 |
35.6 |
28.2730 |
2.6 |
20.045671 |
22.645671 |
1080.0 |
40.0 |
-0.416658 |
5218.209145 |
NaN |
NaN |
| 2026-03-25 10:50:00+08:00 |
170 |
650 |
Ws_E44 |
1.380102 |
30 |
650.00 |
650.333333 |
650.87 |
651.500000 |
5161.0 |
5300.583333 |
52 |
-0.116657 |
-0.215021 |
-0.057045 |
0.474178 |
0.536859 |
27.916667 |
True |
20.0 |
37.8 |
30.0040 |
2.1 |
14.824786 |
16.924786 |
135.0 |
42.0 |
-0.362247 |
5226.459405 |
NaN |
NaN |
| 2026-03-25 14:40:00+08:00 |
170 |
880 |
Ws_E44 |
1.380102 |
30 |
880.00 |
880.166667 |
880.87 |
885.833333 |
4791.0 |
4941.762500 |
52 |
-0.182830 |
-0.137731 |
-0.112840 |
0.199733 |
0.579856 |
30.152500 |
True |
10.0 |
297.8 |
30.1525 |
0.0 |
0.000000 |
0.000000 |
354.0 |
642.0 |
-0.073898 |
NaN |
NaN |
NaN |