| 2025-11-17 07:25:00+08:00 |
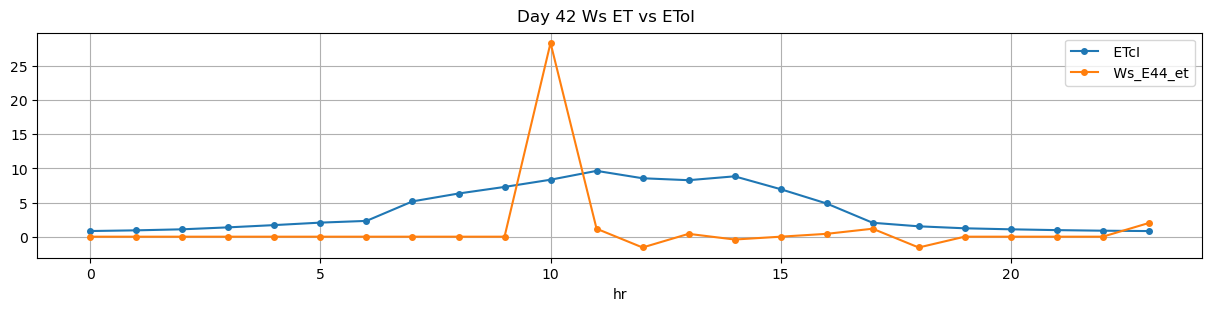
42 |
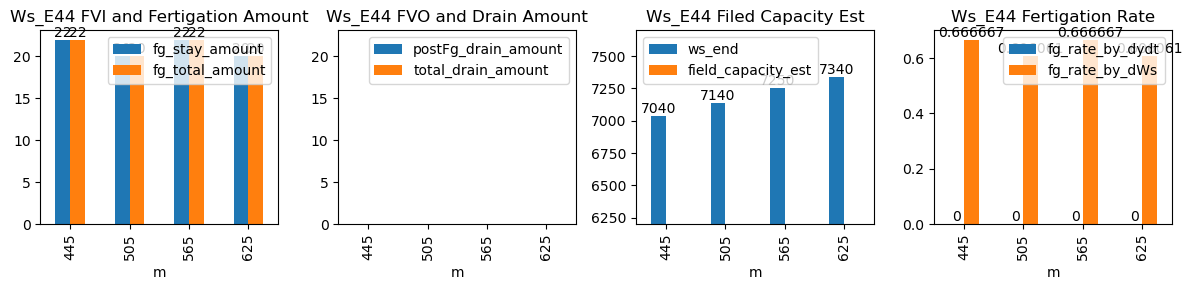
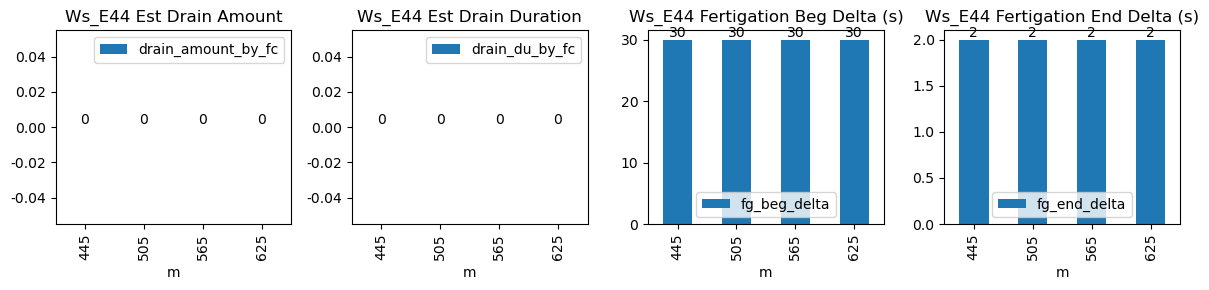
445 |
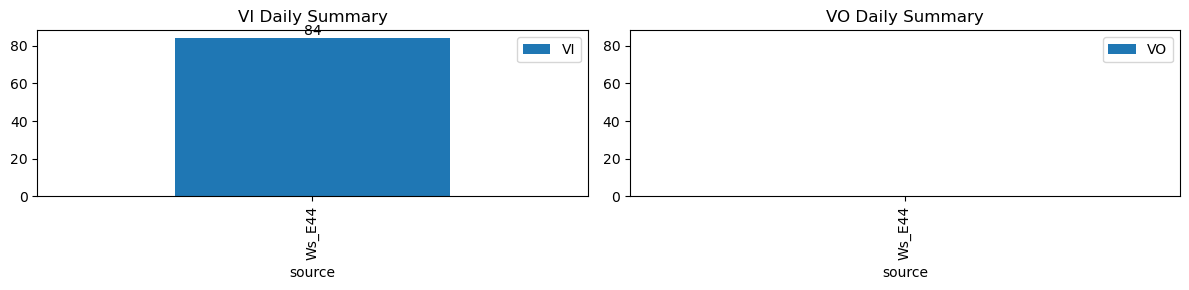
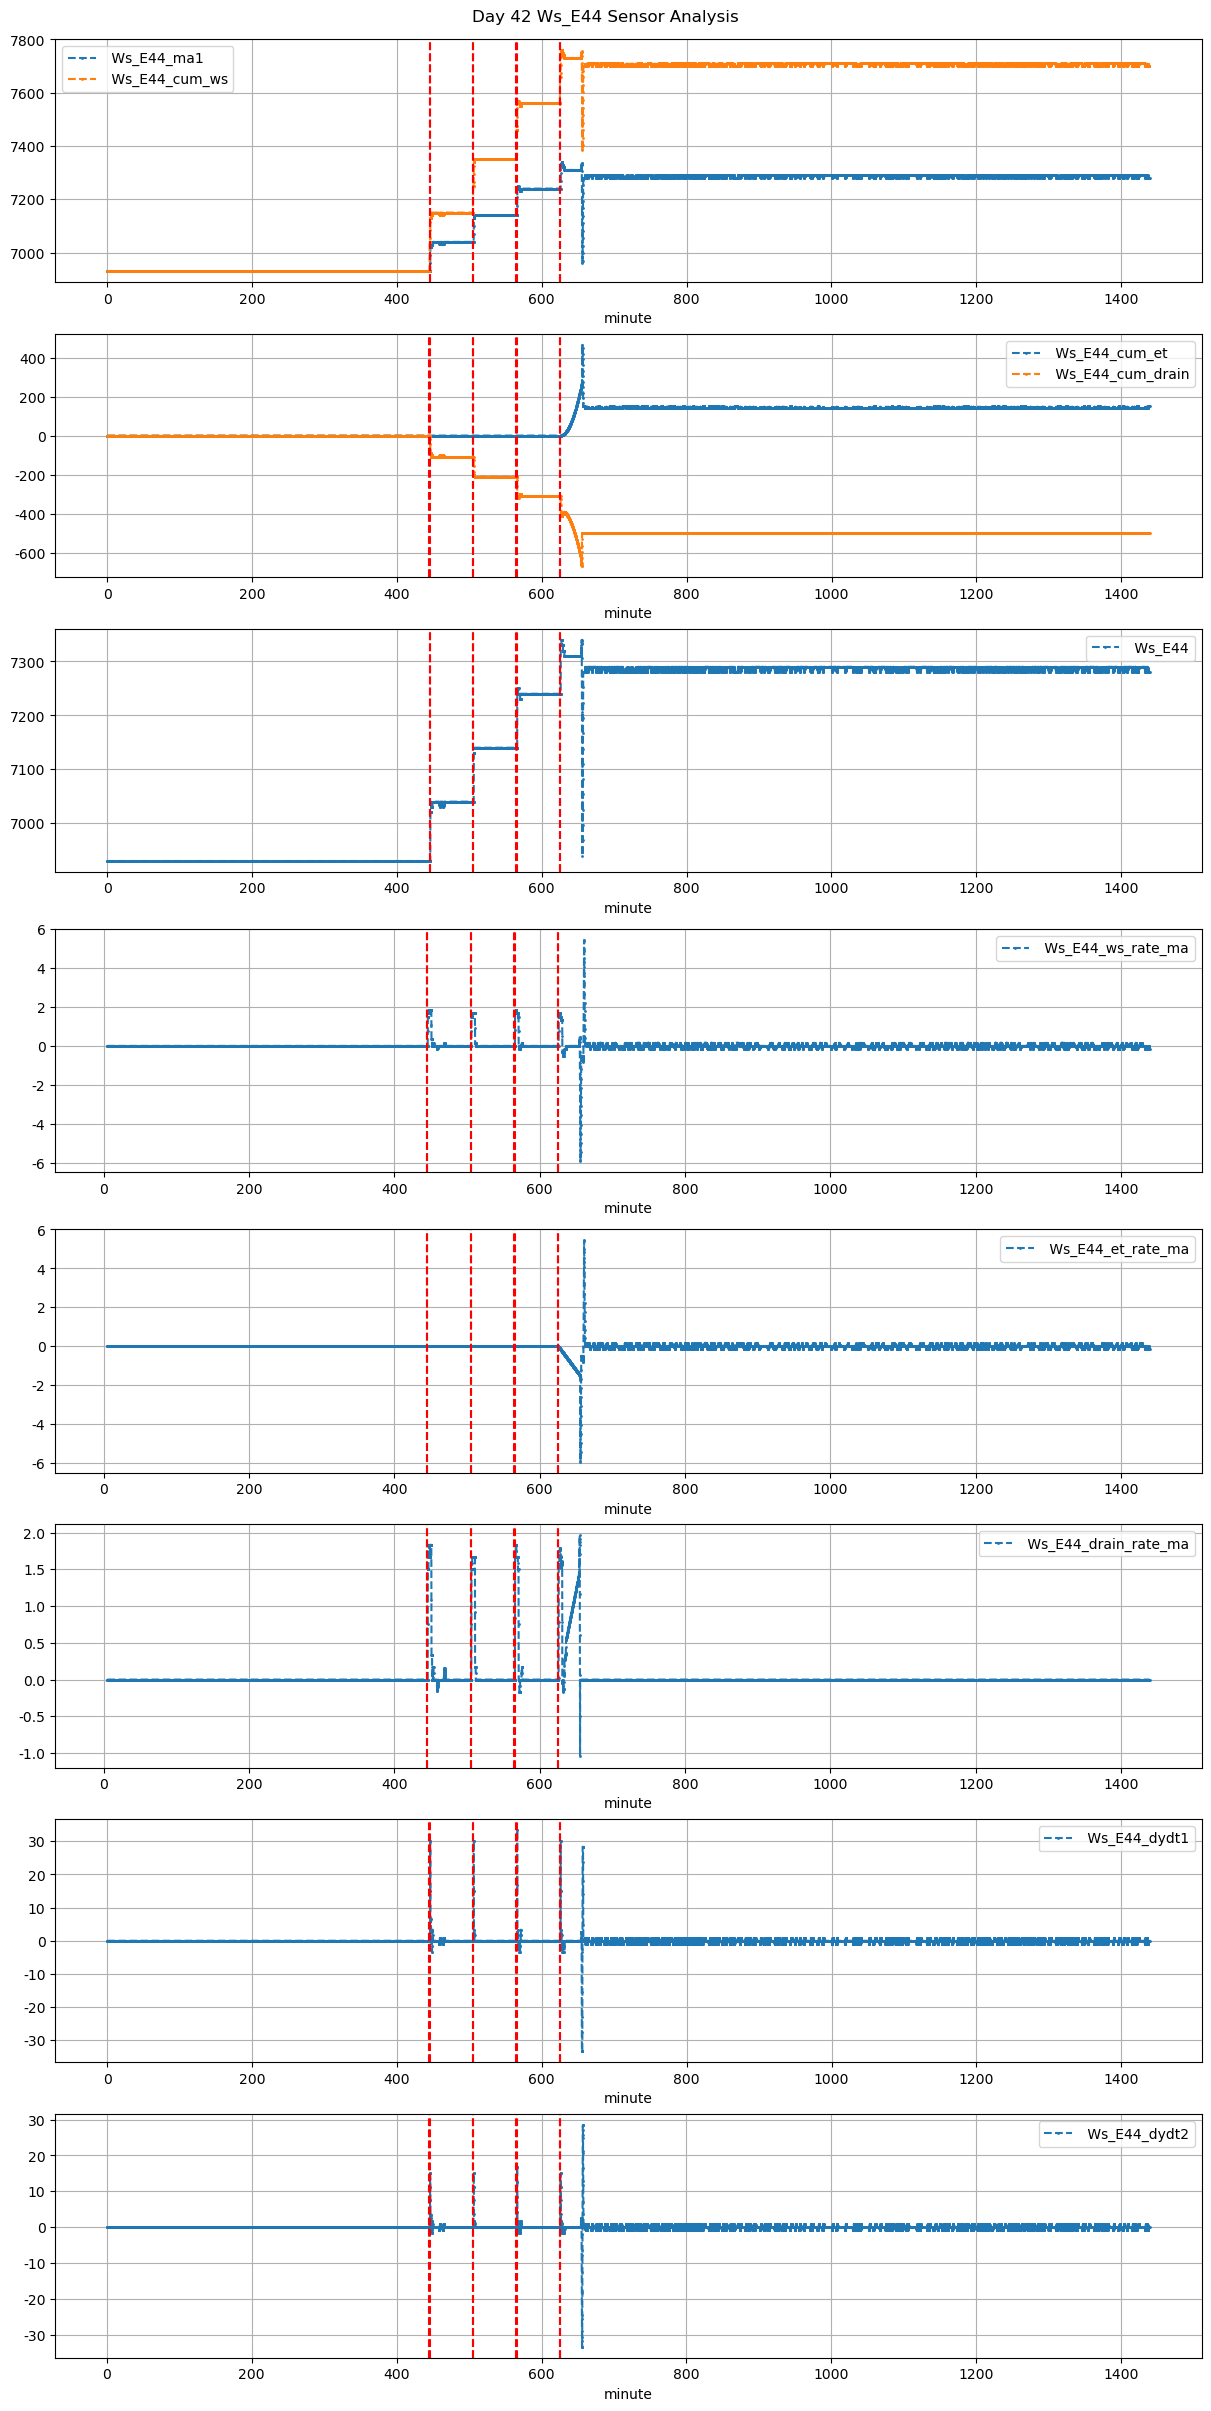
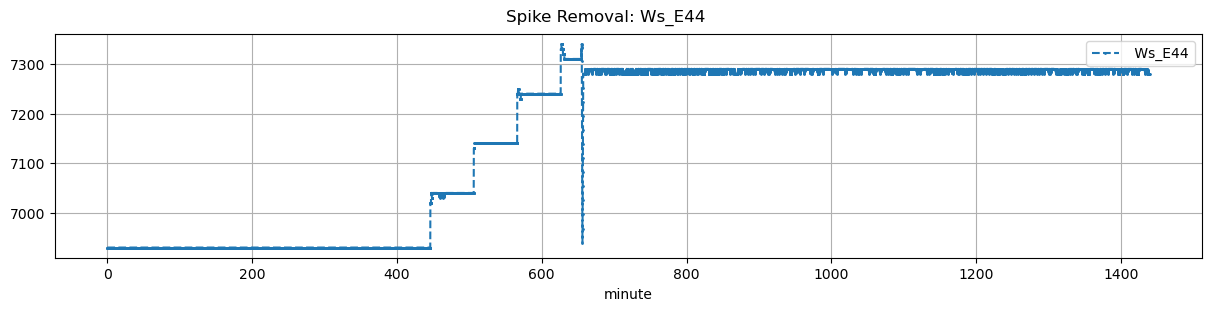
Ws_E44 |
4.106646 |
30 |
445.0 |
445.5 |
445.55 |
445.583333 |
NaN |
NaN |
NaN |
6930.0 |
7040.0 |
33 |
0.0 |
0.0000 |
0.000000 |
NaN |
0.666667 |
22.0 |
30.0 |
2.0 |
22.0 |
0.0 |
-22.000000 |
NaN |
-22.000000 |
| 2025-11-17 08:25:00+08:00 |
42 |
505 |
Ws_E44 |
4.106646 |
30 |
505.0 |
505.5 |
505.55 |
505.583333 |
NaN |
NaN |
NaN |
7040.0 |
7140.0 |
33 |
0.0 |
0.0000 |
0.000000 |
NaN |
0.606061 |
20.0 |
30.0 |
2.0 |
20.0 |
0.0 |
-20.000000 |
NaN |
-20.000000 |
| 2025-11-17 09:25:00+08:00 |
42 |
565 |
Ws_E44 |
4.106646 |
30 |
565.0 |
565.5 |
565.55 |
565.583333 |
NaN |
NaN |
NaN |
7140.0 |
7250.0 |
33 |
0.0 |
0.0000 |
0.000000 |
NaN |
0.666667 |
22.0 |
30.0 |
2.0 |
22.0 |
0.0 |
-20.000000 |
NaN |
-20.000000 |
| 2025-11-17 10:25:00+08:00 |
42 |
625 |
Ws_E44 |
4.106646 |
30 |
625.0 |
625.5 |
625.55 |
625.583333 |
NaN |
NaN |
NaN |
7240.0 |
7340.0 |
33 |
0.0 |
-0.1125 |
-1.509259 |
NaN |
0.606061 |
20.0 |
30.0 |
2.0 |
20.0 |
0.0 |
-37.967682 |
NaN |
-37.967682 |