| 2025-11-18 08:15:00+08:00 |
43 |
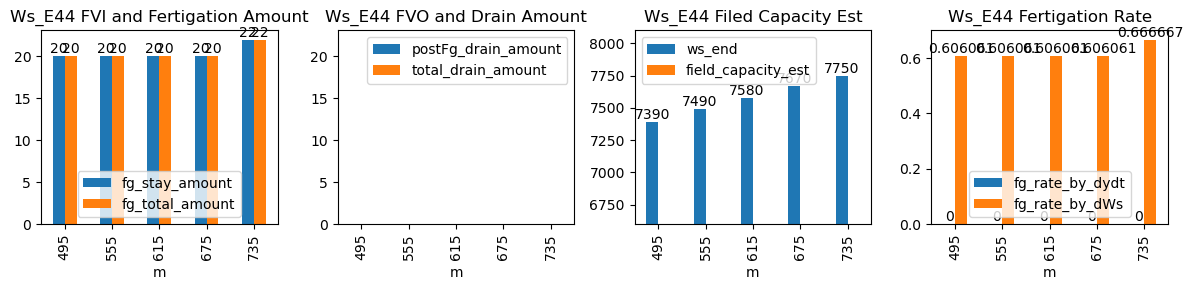
495 |
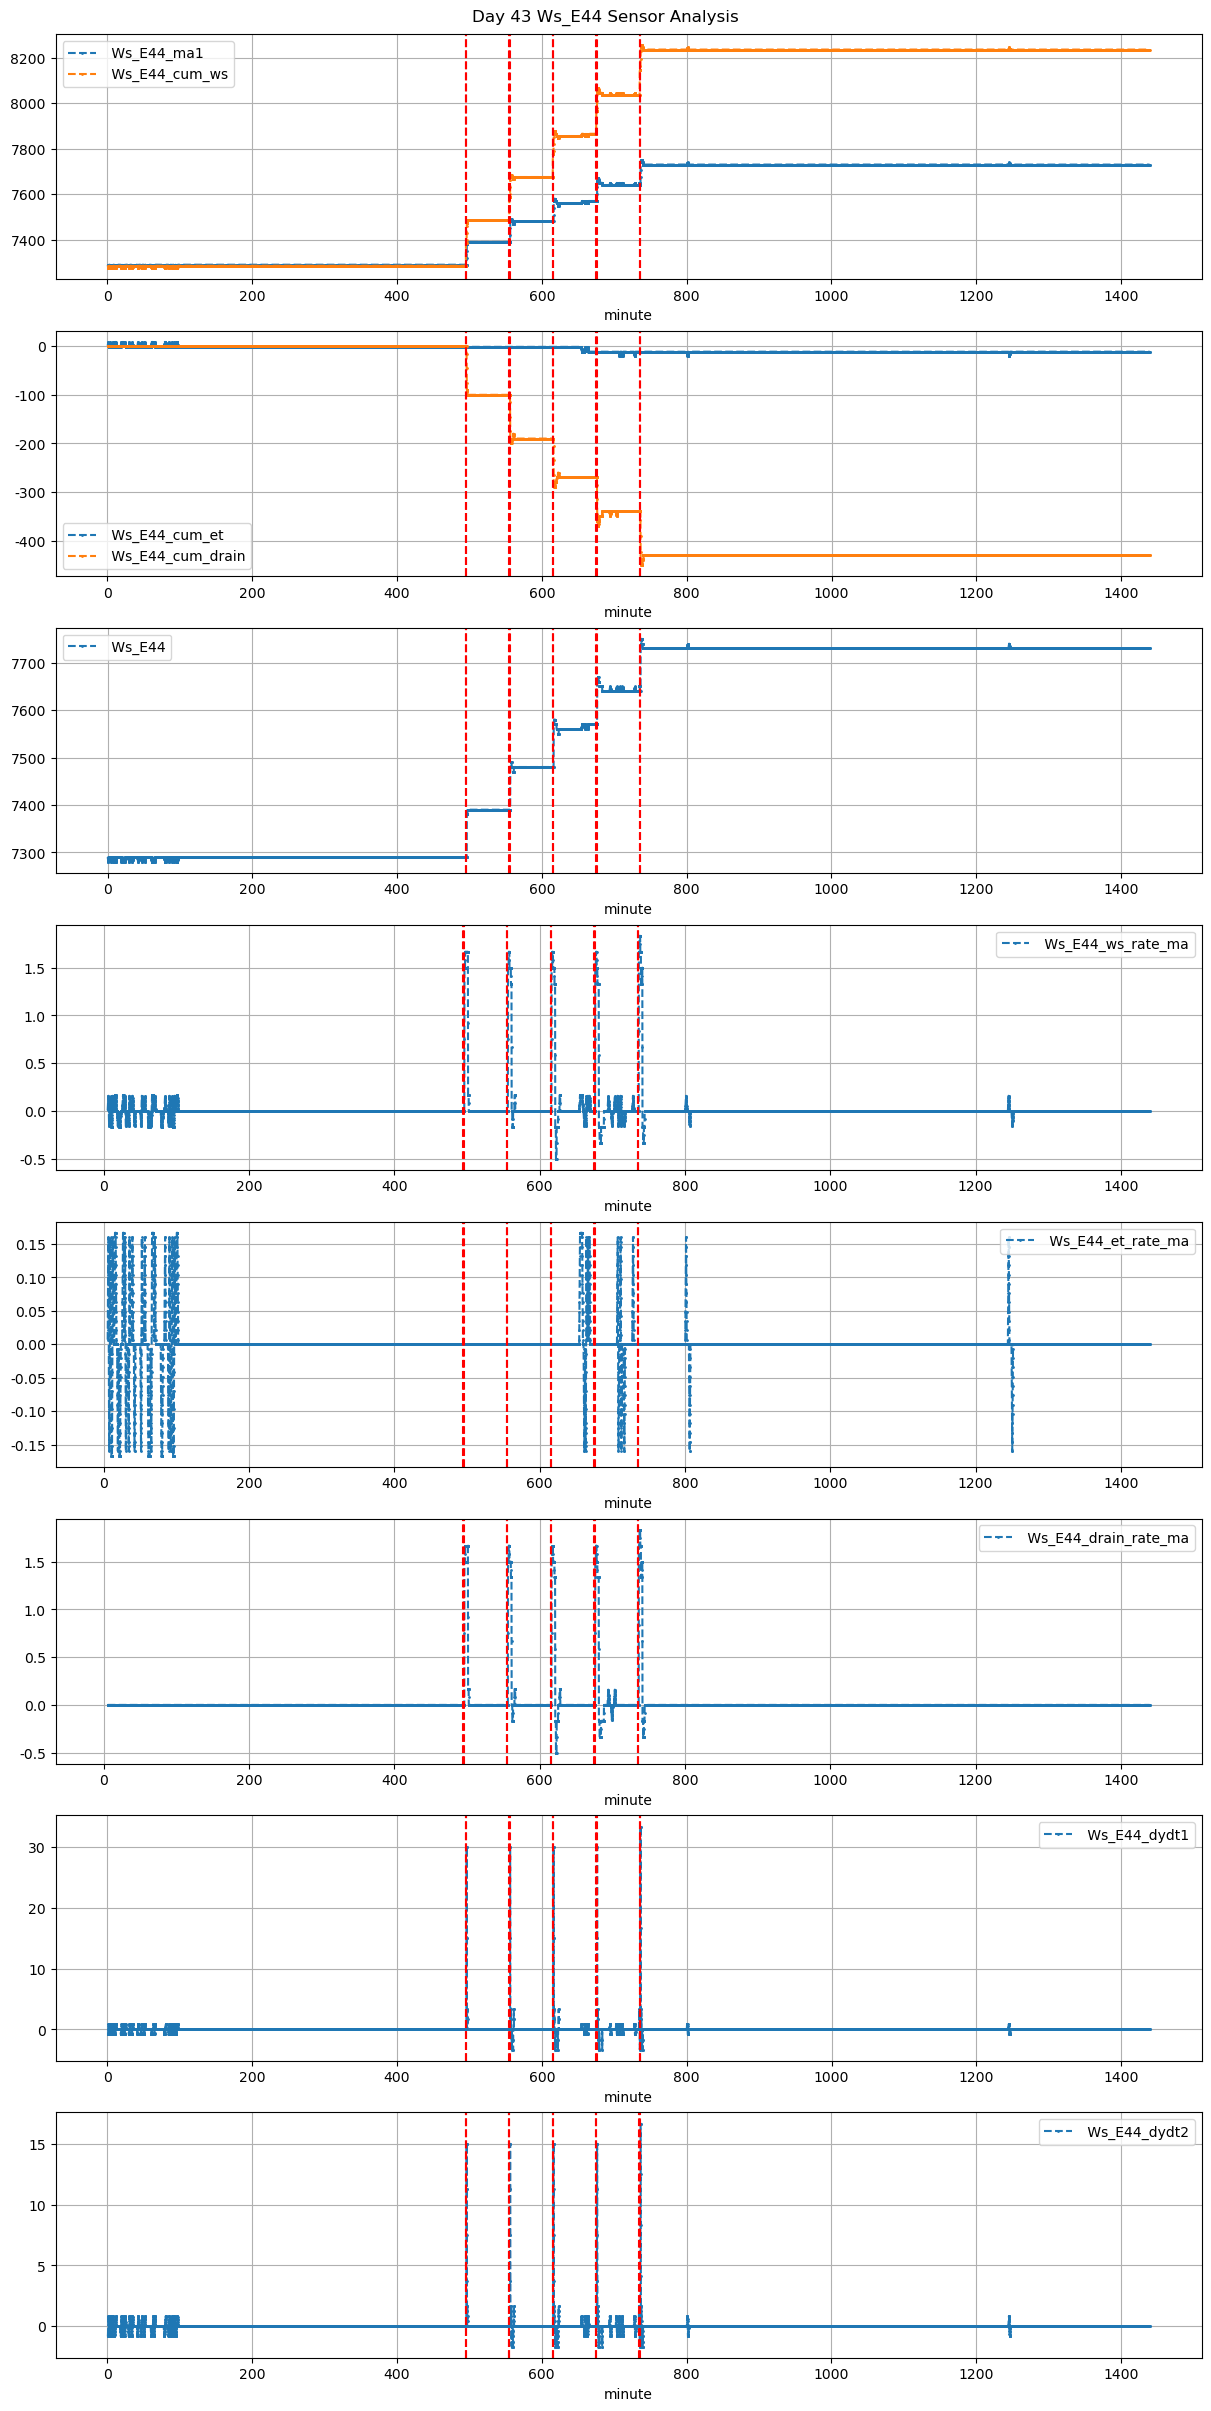
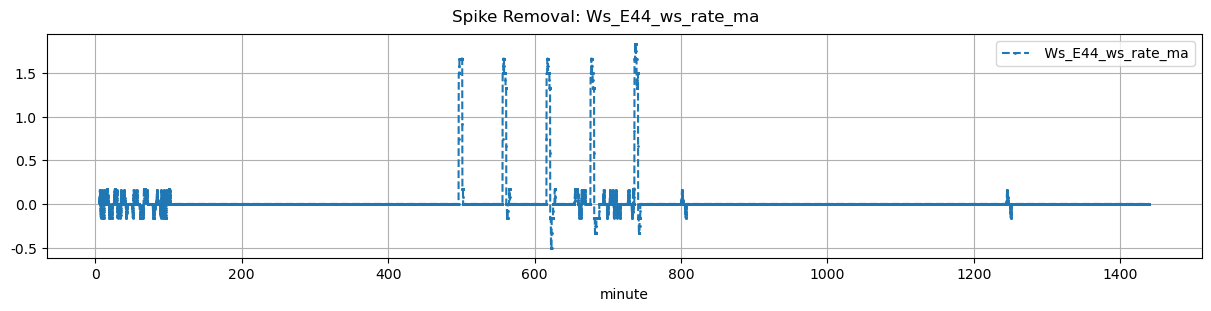
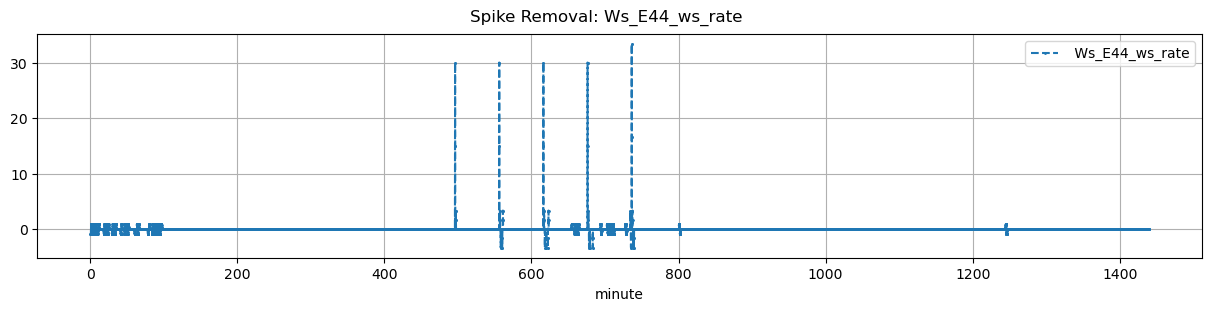
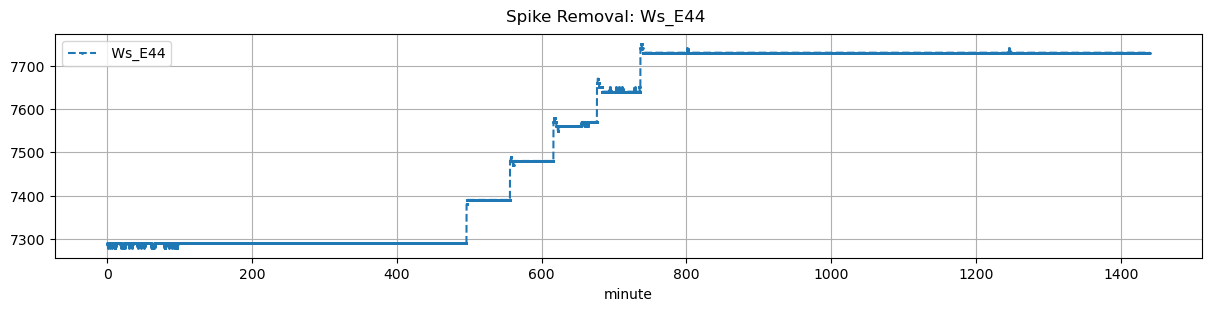
Ws_E44 |
2.014786 |
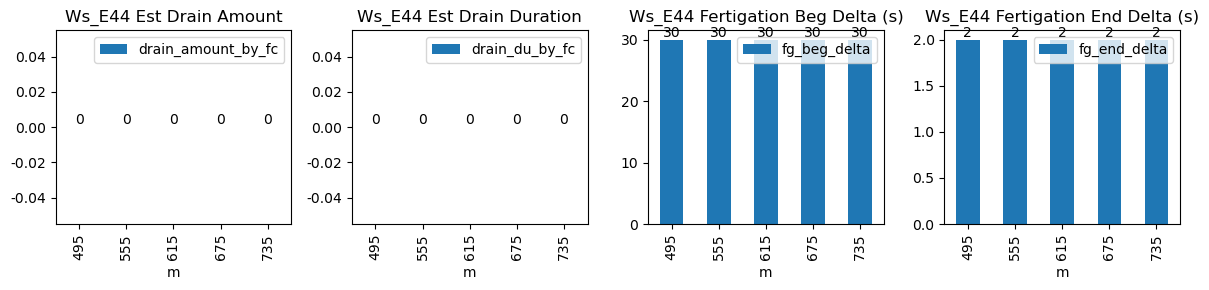
30 |
495.0 |
495.5 |
495.55 |
495.583333 |
NaN |
NaN |
NaN |
7290.0 |
7390.0 |
33 |
0.000000 |
0.000000 |
0.0 |
NaN |
0.606061 |
20.0 |
30.0 |
2.0 |
20.0 |
0.0 |
-20.0 |
NaN |
-20.0 |
| 2025-11-18 09:15:00+08:00 |
43 |
555 |
Ws_E44 |
2.014786 |
30 |
555.0 |
555.5 |
555.55 |
555.583333 |
NaN |
NaN |
NaN |
7390.0 |
7490.0 |
33 |
0.000000 |
0.000000 |
0.0 |
NaN |
0.606061 |
20.0 |
30.0 |
2.0 |
20.0 |
0.0 |
-18.0 |
NaN |
-18.0 |
| 2025-11-18 10:15:00+08:00 |
43 |
615 |
Ws_E44 |
2.014786 |
30 |
615.0 |
615.5 |
615.55 |
615.583333 |
NaN |
NaN |
NaN |
7480.0 |
7580.0 |
33 |
0.000000 |
-0.011111 |
0.0 |
NaN |
0.606061 |
20.0 |
30.0 |
2.0 |
20.0 |
0.0 |
-16.0 |
NaN |
-16.0 |
| 2025-11-18 11:15:00+08:00 |
43 |
675 |
Ws_E44 |
2.014786 |
30 |
675.0 |
675.5 |
675.55 |
675.583333 |
NaN |
NaN |
NaN |
7570.0 |
7670.0 |
33 |
0.000000 |
0.000000 |
0.0 |
NaN |
0.606061 |
20.0 |
30.0 |
2.0 |
20.0 |
0.0 |
-14.0 |
NaN |
-14.0 |
| 2025-11-18 12:15:00+08:00 |
43 |
735 |
Ws_E44 |
2.014786 |
30 |
735.0 |
735.5 |
735.55 |
735.583333 |
NaN |
NaN |
NaN |
7640.0 |
7750.0 |
33 |
-0.009887 |
0.000000 |
0.0 |
NaN |
0.666667 |
22.0 |
30.0 |
2.0 |
22.0 |
0.0 |
-18.0 |
NaN |
-18.0 |