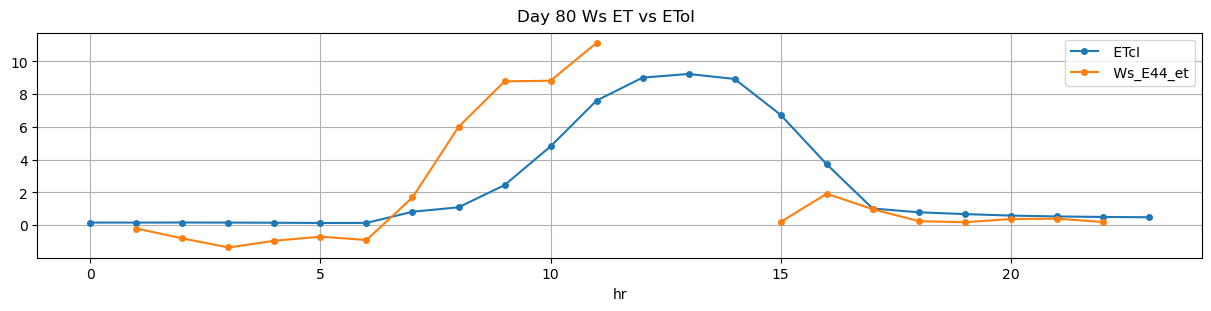
| 2025-12-25 11:06:06+08:00 |
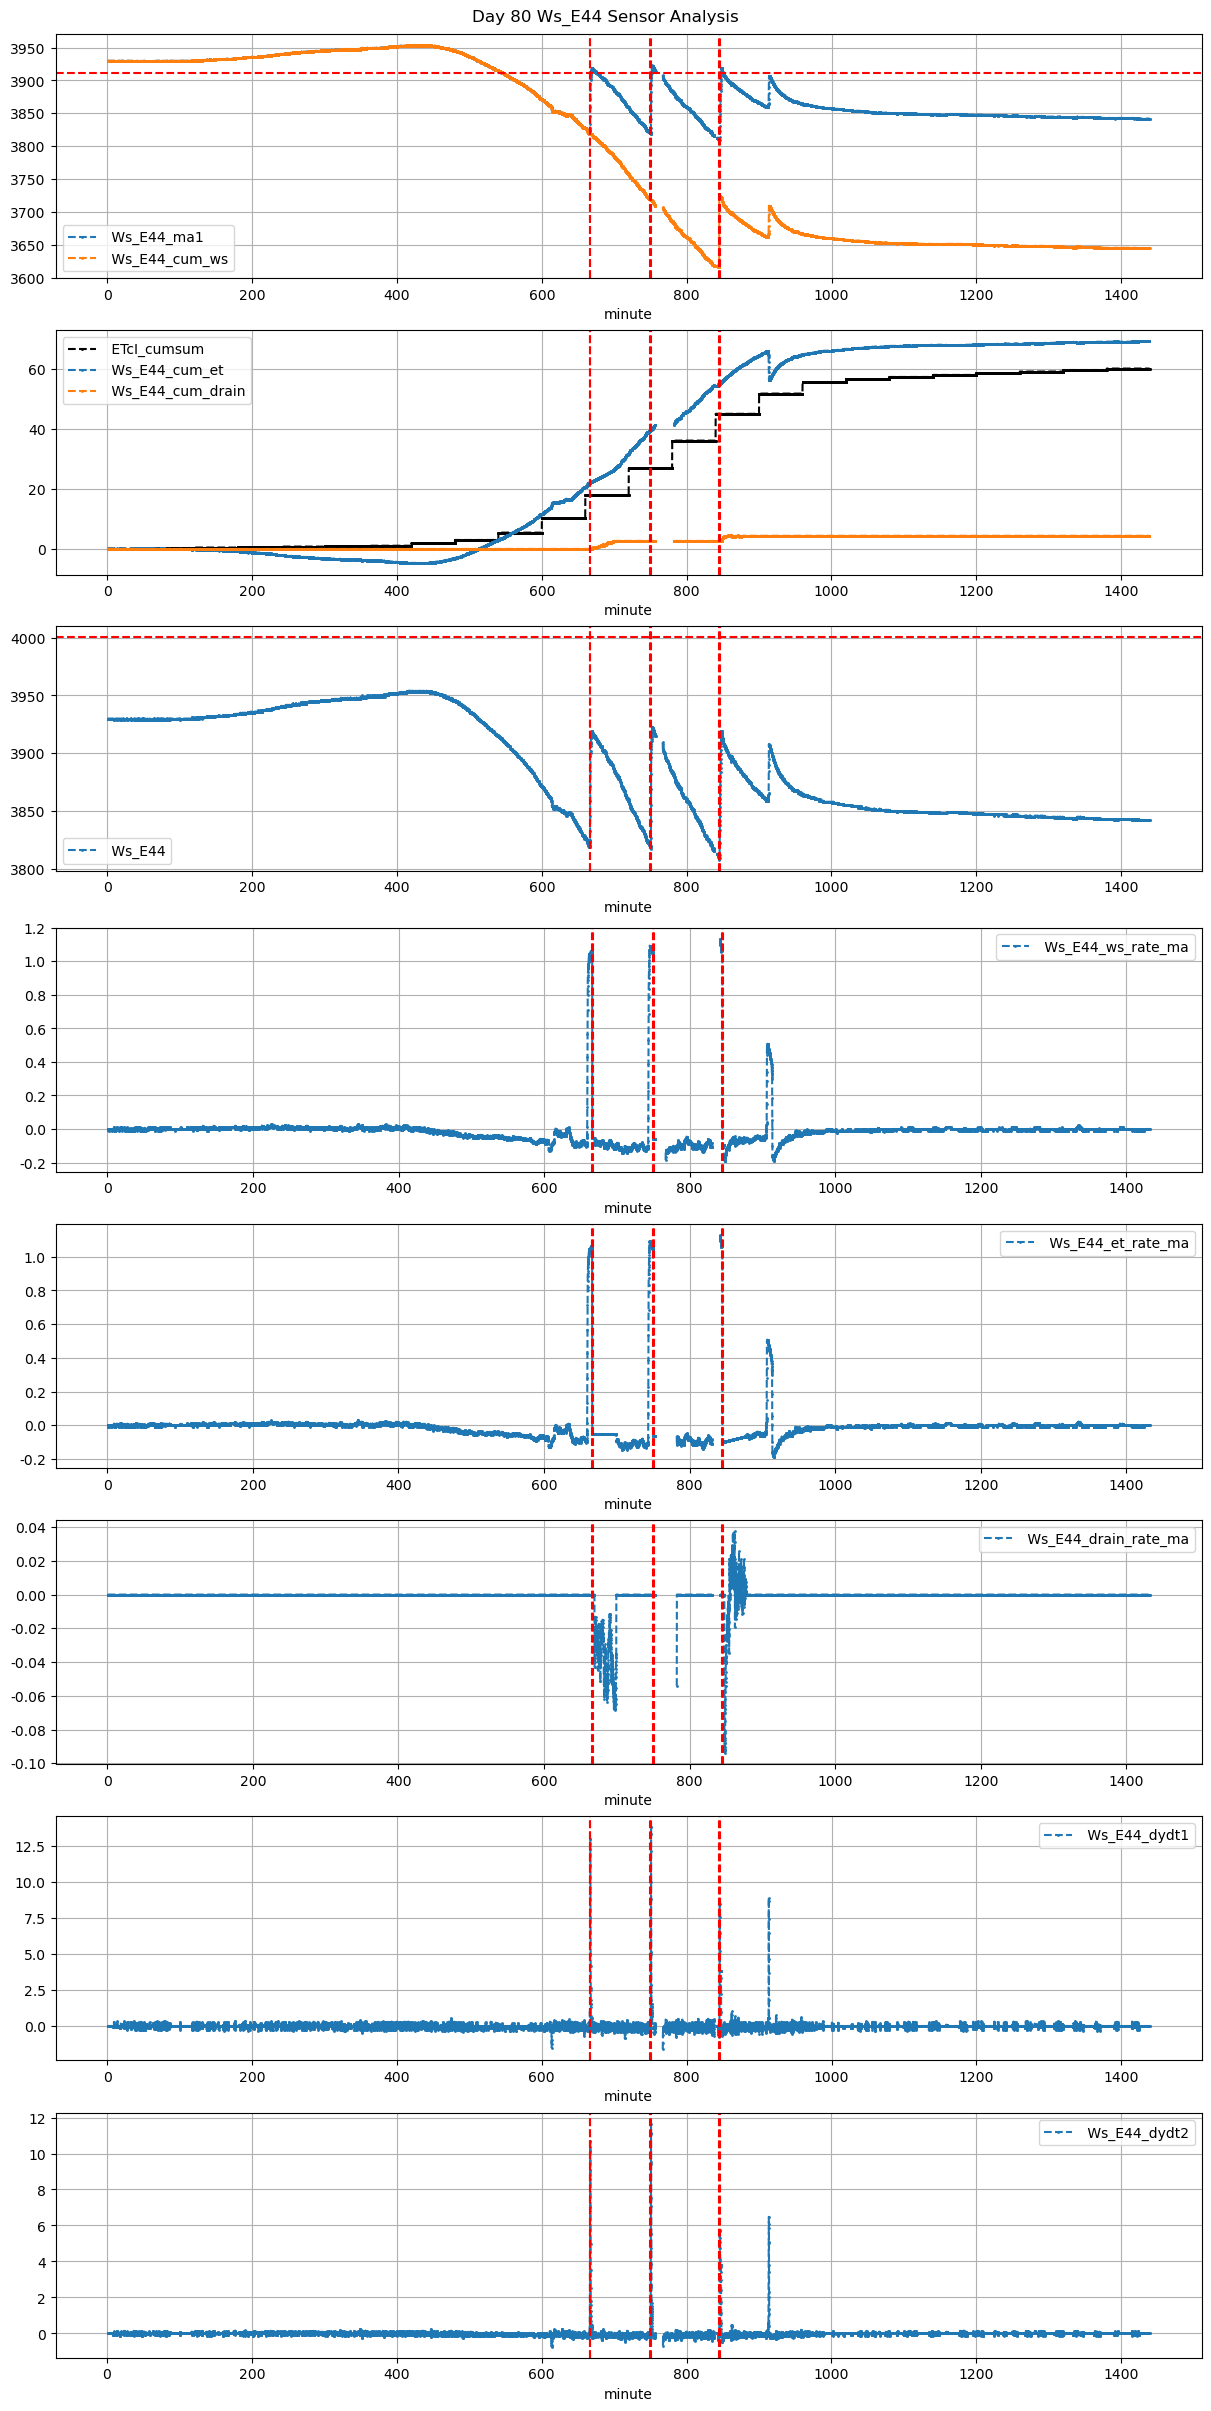
80 |
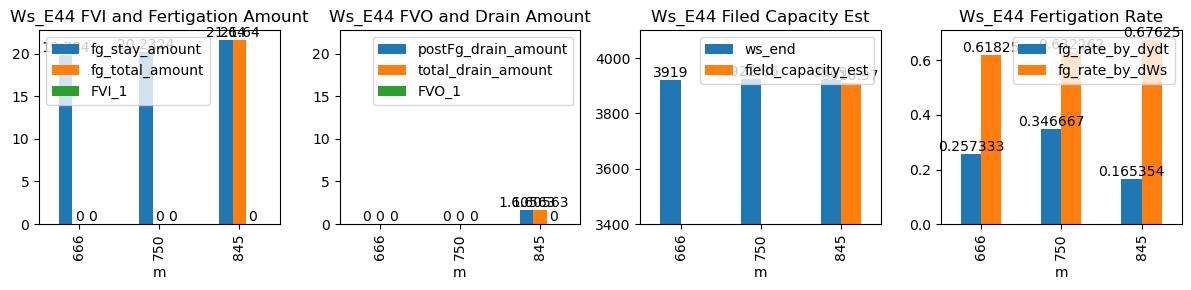
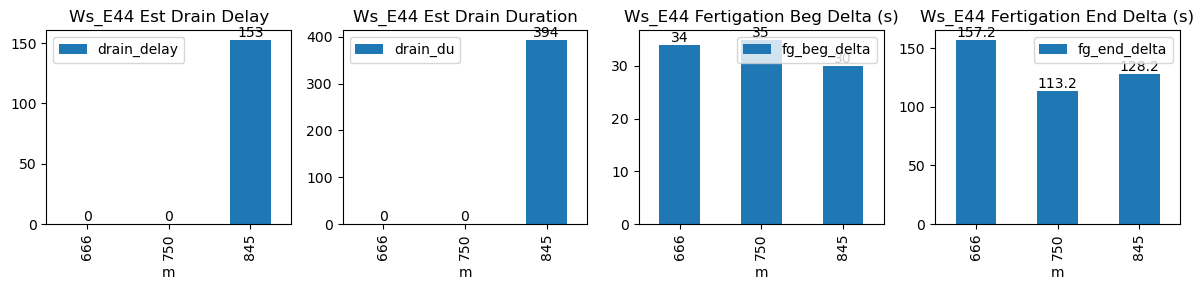
666 |
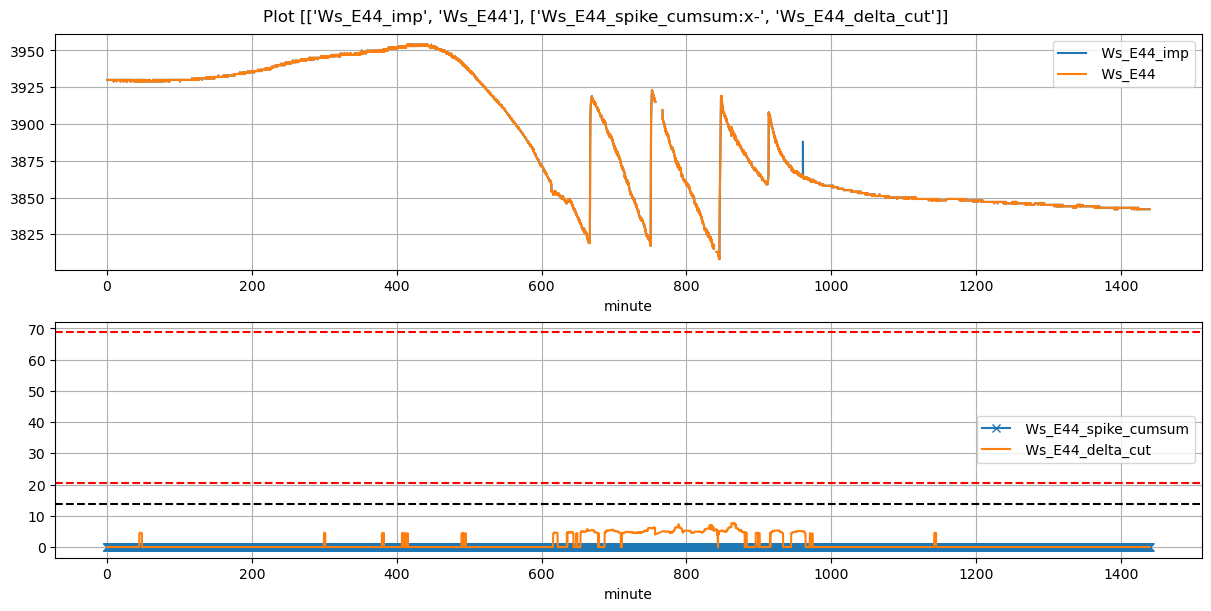
Ws_E44 |
0.334747 |
30 |
666.1 |
666.666667 |
666.63 |
669.250000 |
3820.080000 |
3919.000000 |
32 |
-0.052833 |
-0.082579 |
-0.052833 |
0.257333 |
0.618250 |
19.784000 |
False |
34.0 |
157.2 |
NaN |
NaN |
NaN |
NaN |
NaN |
NaN |
NaN |
NaN |
NaN |
NaN |
| 2025-12-25 12:30:00+08:00 |
80 |
750 |
Ws_E44 |
0.334747 |
30 |
750.0 |
750.583333 |
750.53 |
752.416667 |
3821.695238 |
3922.857143 |
32 |
-0.062555 |
NaN |
-0.062555 |
0.346667 |
0.632262 |
20.232381 |
False |
35.0 |
113.2 |
NaN |
NaN |
NaN |
NaN |
NaN |
NaN |
NaN |
NaN |
NaN |
NaN |
| 2025-12-25 14:05:00+08:00 |
80 |
845 |
Ws_E44 |
0.334747 |
30 |
845.0 |
845.500000 |
845.53 |
847.666667 |
3810.800000 |
3919.000000 |
32 |
-0.097407 |
-0.125926 |
-0.065062 |
0.165354 |
0.676250 |
21.640000 |
True |
30.0 |
128.2 |
21.64 |
0.0 |
1.605632 |
1.605632 |
394.0 |
153.0 |
-0.086542 |
3910.971839 |
NaN |
NaN |