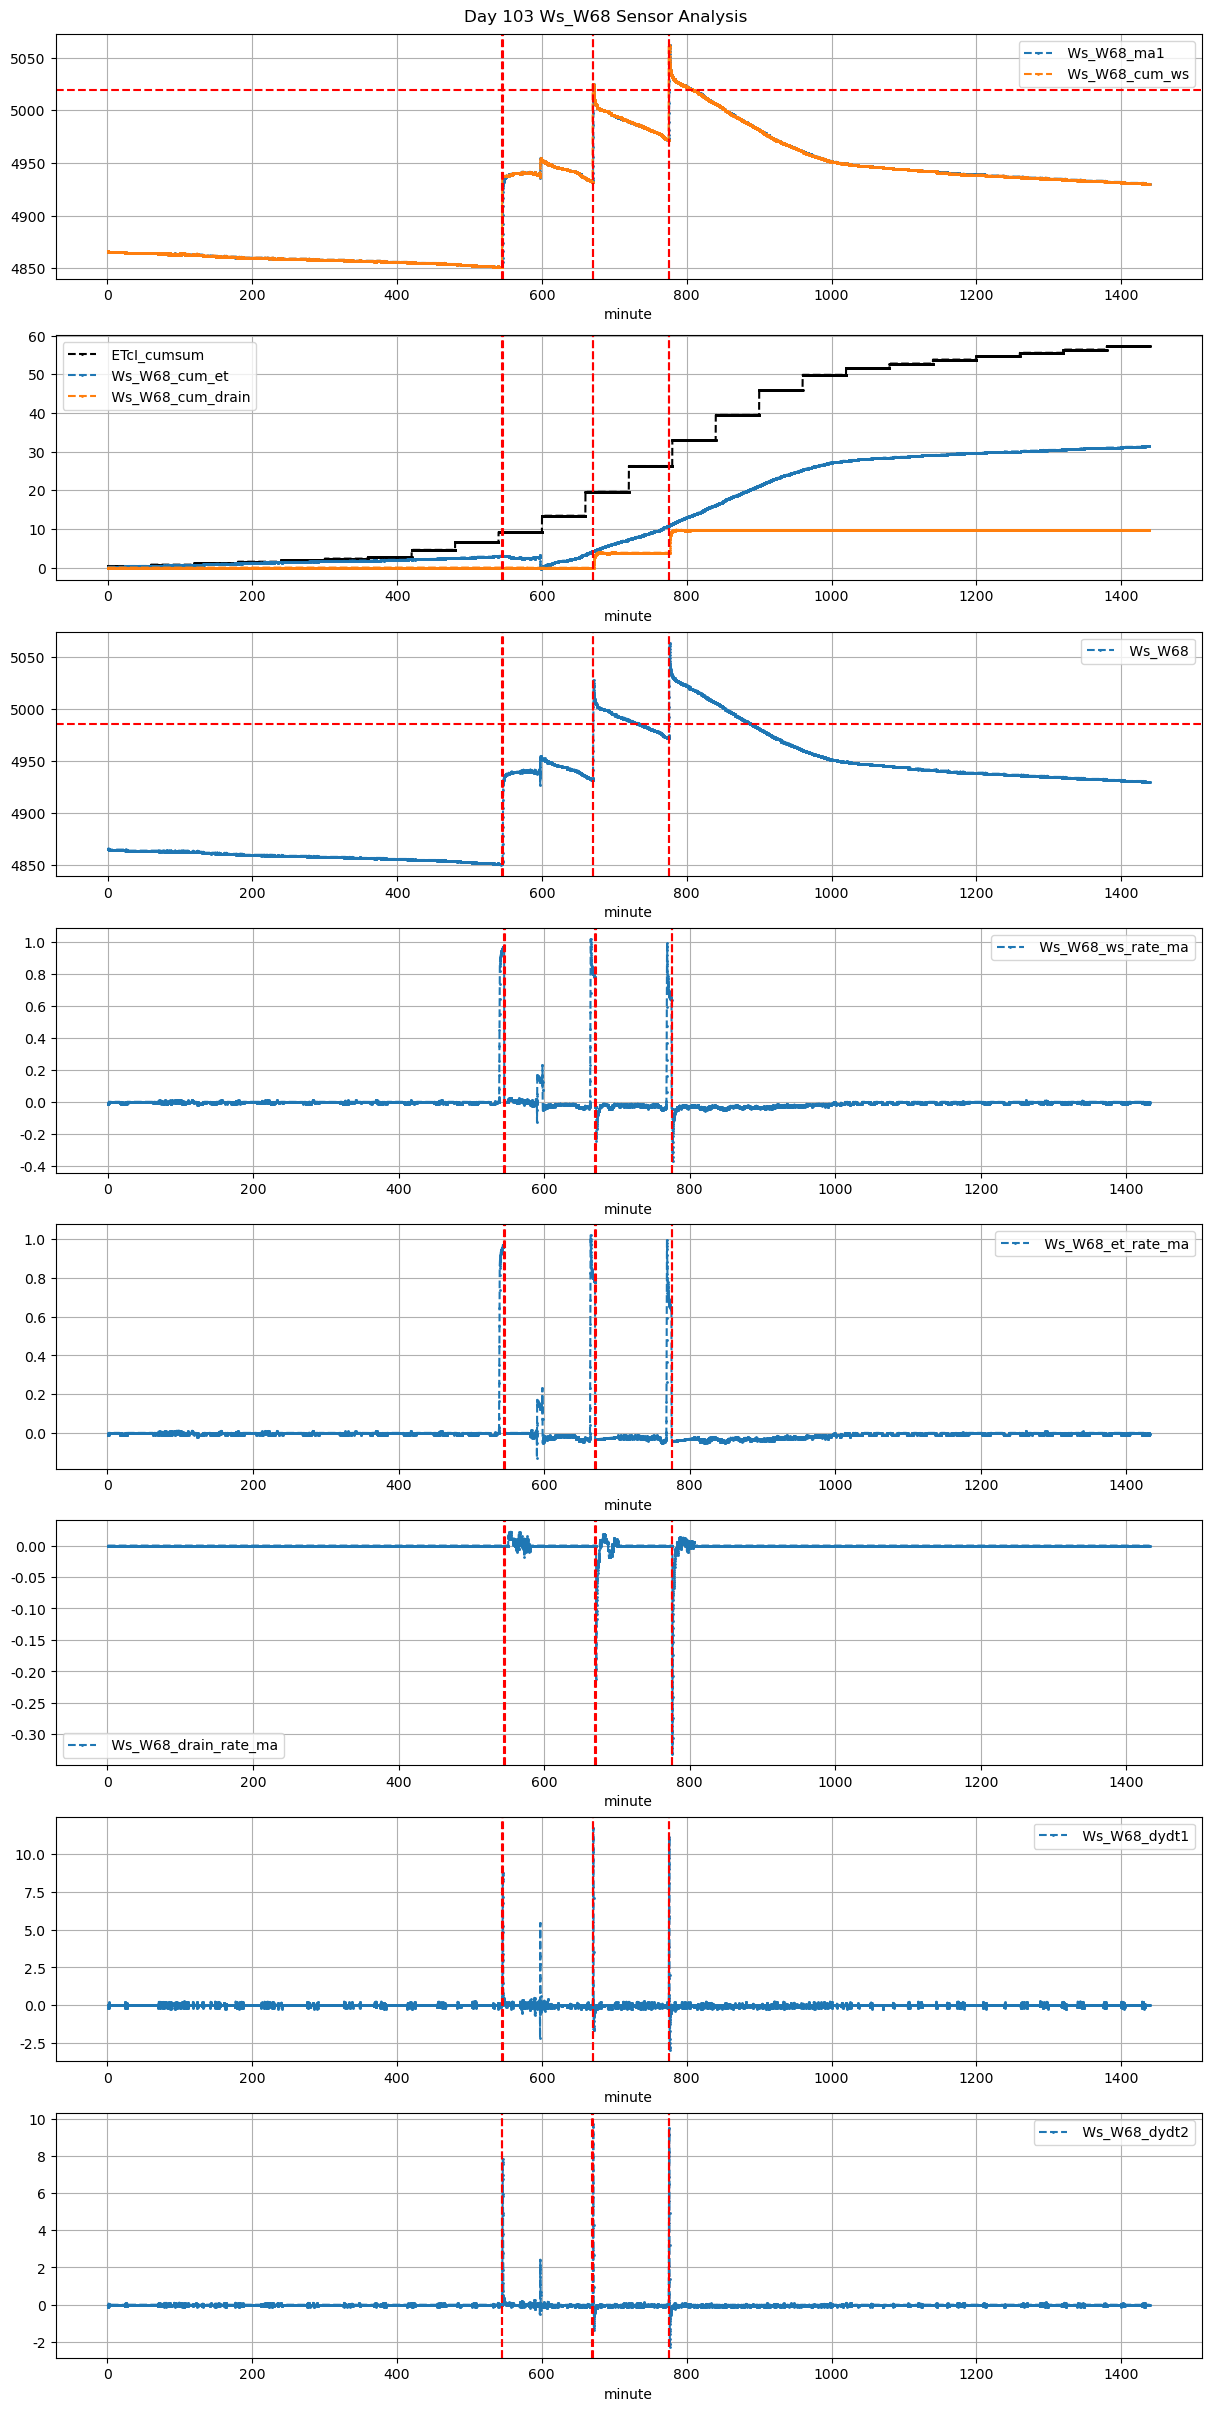
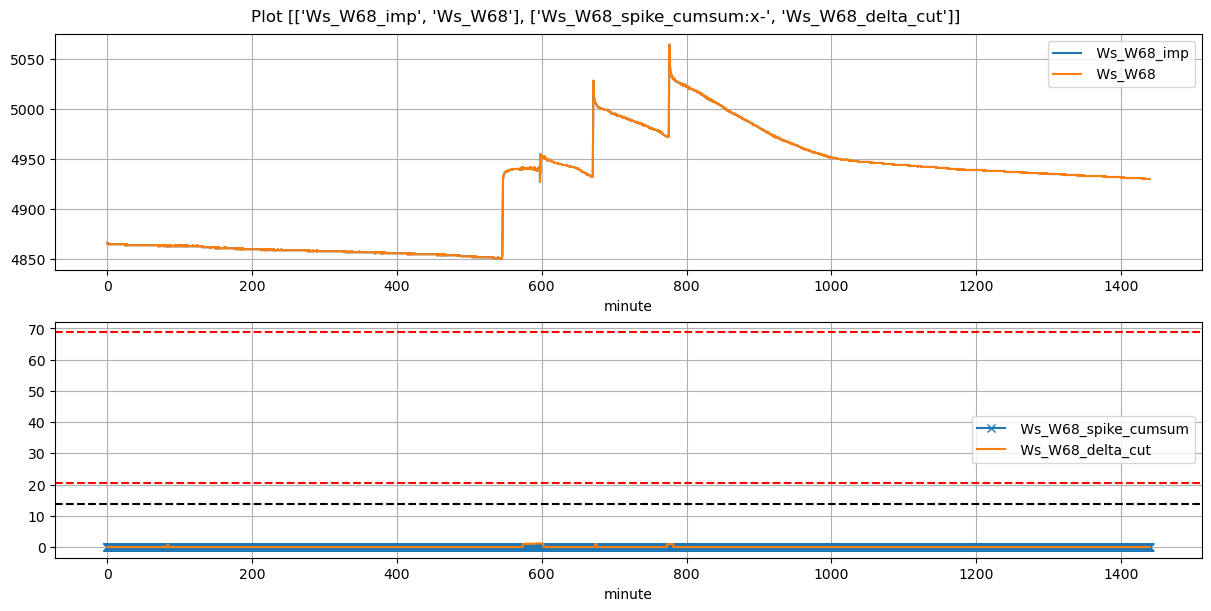
| 2026-01-17 09:05:00+08:00 |
103 |
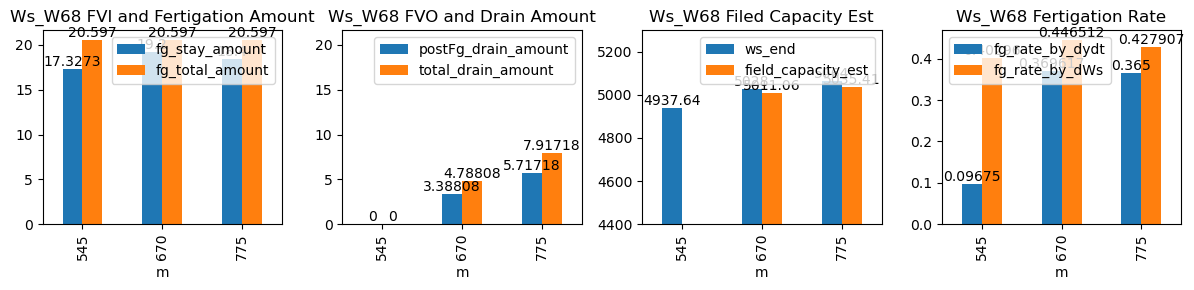
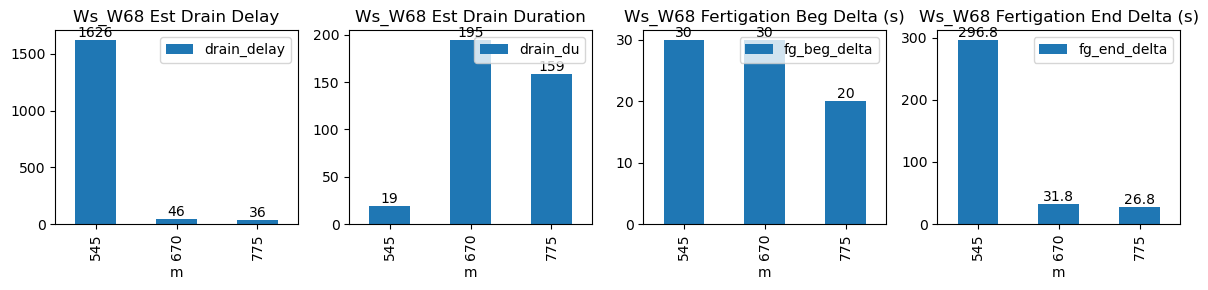
545 |
Ws_W68 |
0.294692 |
30 |
545.0 |
545.500000 |
545.72 |
550.666667 |
4851.0 |
4937.636364 |
43 |
-0.001836 |
0.000000 |
0.000000 |
0.096750 |
0.402960 |
17.327273 |
True |
30.0 |
296.8 |
20.597 |
0.0 |
0.000000 |
0.000000 |
19 |
1626 |
-0.352083 |
NaN |
| 2026-01-17 11:10:00+08:00 |
103 |
670 |
Ws_W68 |
0.294692 |
30 |
670.0 |
670.500000 |
670.72 |
671.250000 |
4932.0 |
5028.000000 |
43 |
-0.032062 |
-0.124301 |
-0.019514 |
0.369617 |
0.446512 |
19.200000 |
True |
30.0 |
31.8 |
20.597 |
1.4 |
3.388078 |
4.788078 |
195 |
46 |
-0.752643 |
5011.059612 |
| 2026-01-17 12:55:00+08:00 |
103 |
775 |
Ws_W68 |
0.294692 |
30 |
775.0 |
775.333333 |
775.72 |
776.166667 |
4972.0 |
5064.000000 |
43 |
-0.035311 |
-0.151667 |
-0.026250 |
0.365000 |
0.427907 |
18.400000 |
True |
20.0 |
26.8 |
20.597 |
2.2 |
5.717176 |
7.917176 |
159 |
36 |
-0.939952 |
5035.414119 |