VI and VO Daily Summary
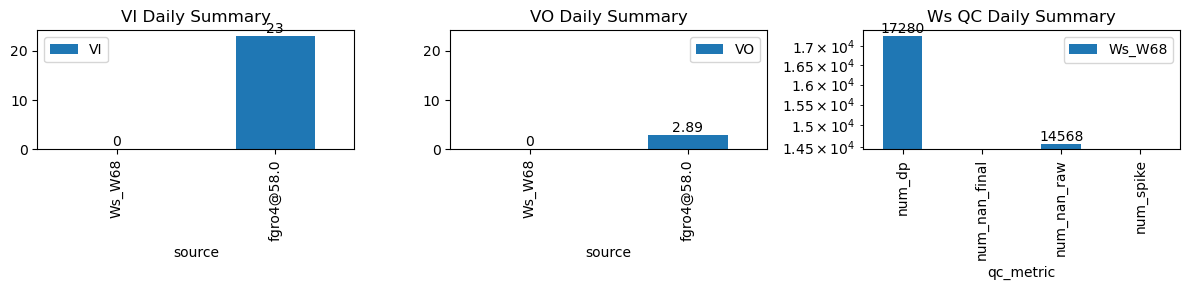
| ws_name | num_dp | num_nan_raw | num_nan_final | num_spike | cum_step_adj |
|---|---|---|---|---|---|
| Ws_W68 | 17,280 | 14,568 | 0 | 0 | 0.00 |
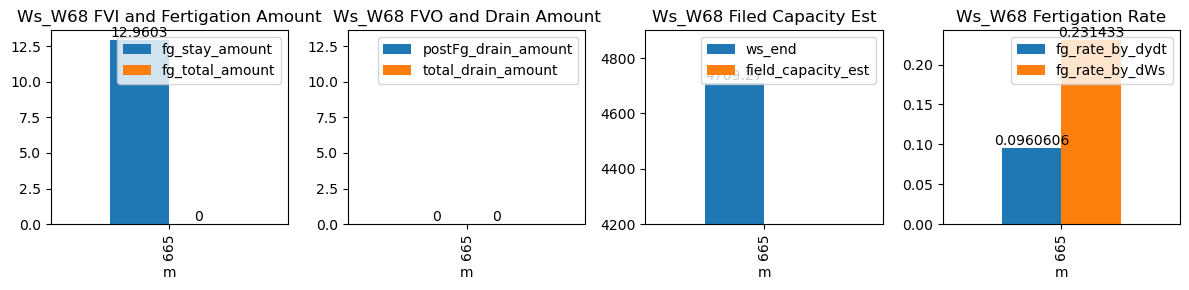
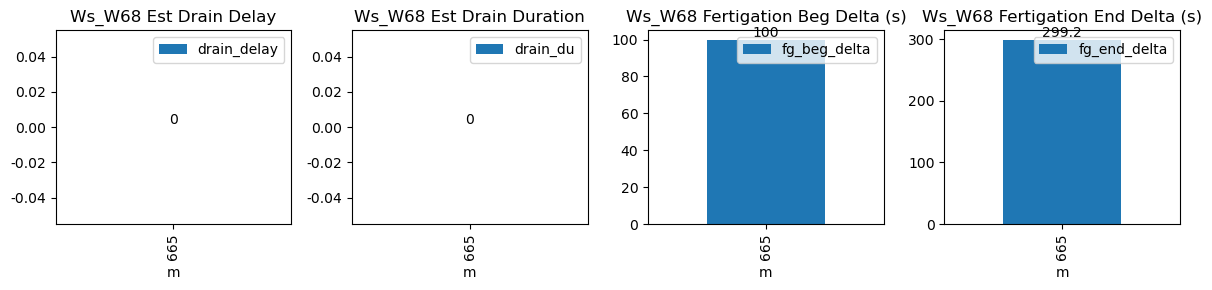
| ds | d | m | ws_name | prominence_cut | max_drain_du | fg_beg | fg_beg_est | fg_end | fg_end_est | ws_beg | ws_end | duc | pre_fg_et | post_fg_ws | post_drn_et | fg_rate_by_dydt | fg_rate_by_dWs | fg_stay_amount | enough_data | fg_beg_delta | fg_end_delta | fg_total_amount | fg_drain_amount | postFg_drain_amount | total_drain_amount | drain_du | drain_delay | drain_rate | field_capacity_est |
|---|---|---|---|---|---|---|---|---|---|---|---|---|---|---|---|---|---|---|---|---|---|---|---|---|---|---|---|---|---|
| 2026-01-31 11:05:00+08:00 | 117 | 665 | Ws_W68 | 0.12542 | 30 | 665.0 | 666.666667 | 665.93 | 670.916667 | 4644.471429 | 4709.272727 | 56 | -0.038034 | 0.0 | -0.038034 | 0.096061 | 0.231433 | 12.96026 | False | 100.0 | 299.2 | NaN | NaN | NaN | NaN | NaN | NaN | NaN | NaN |