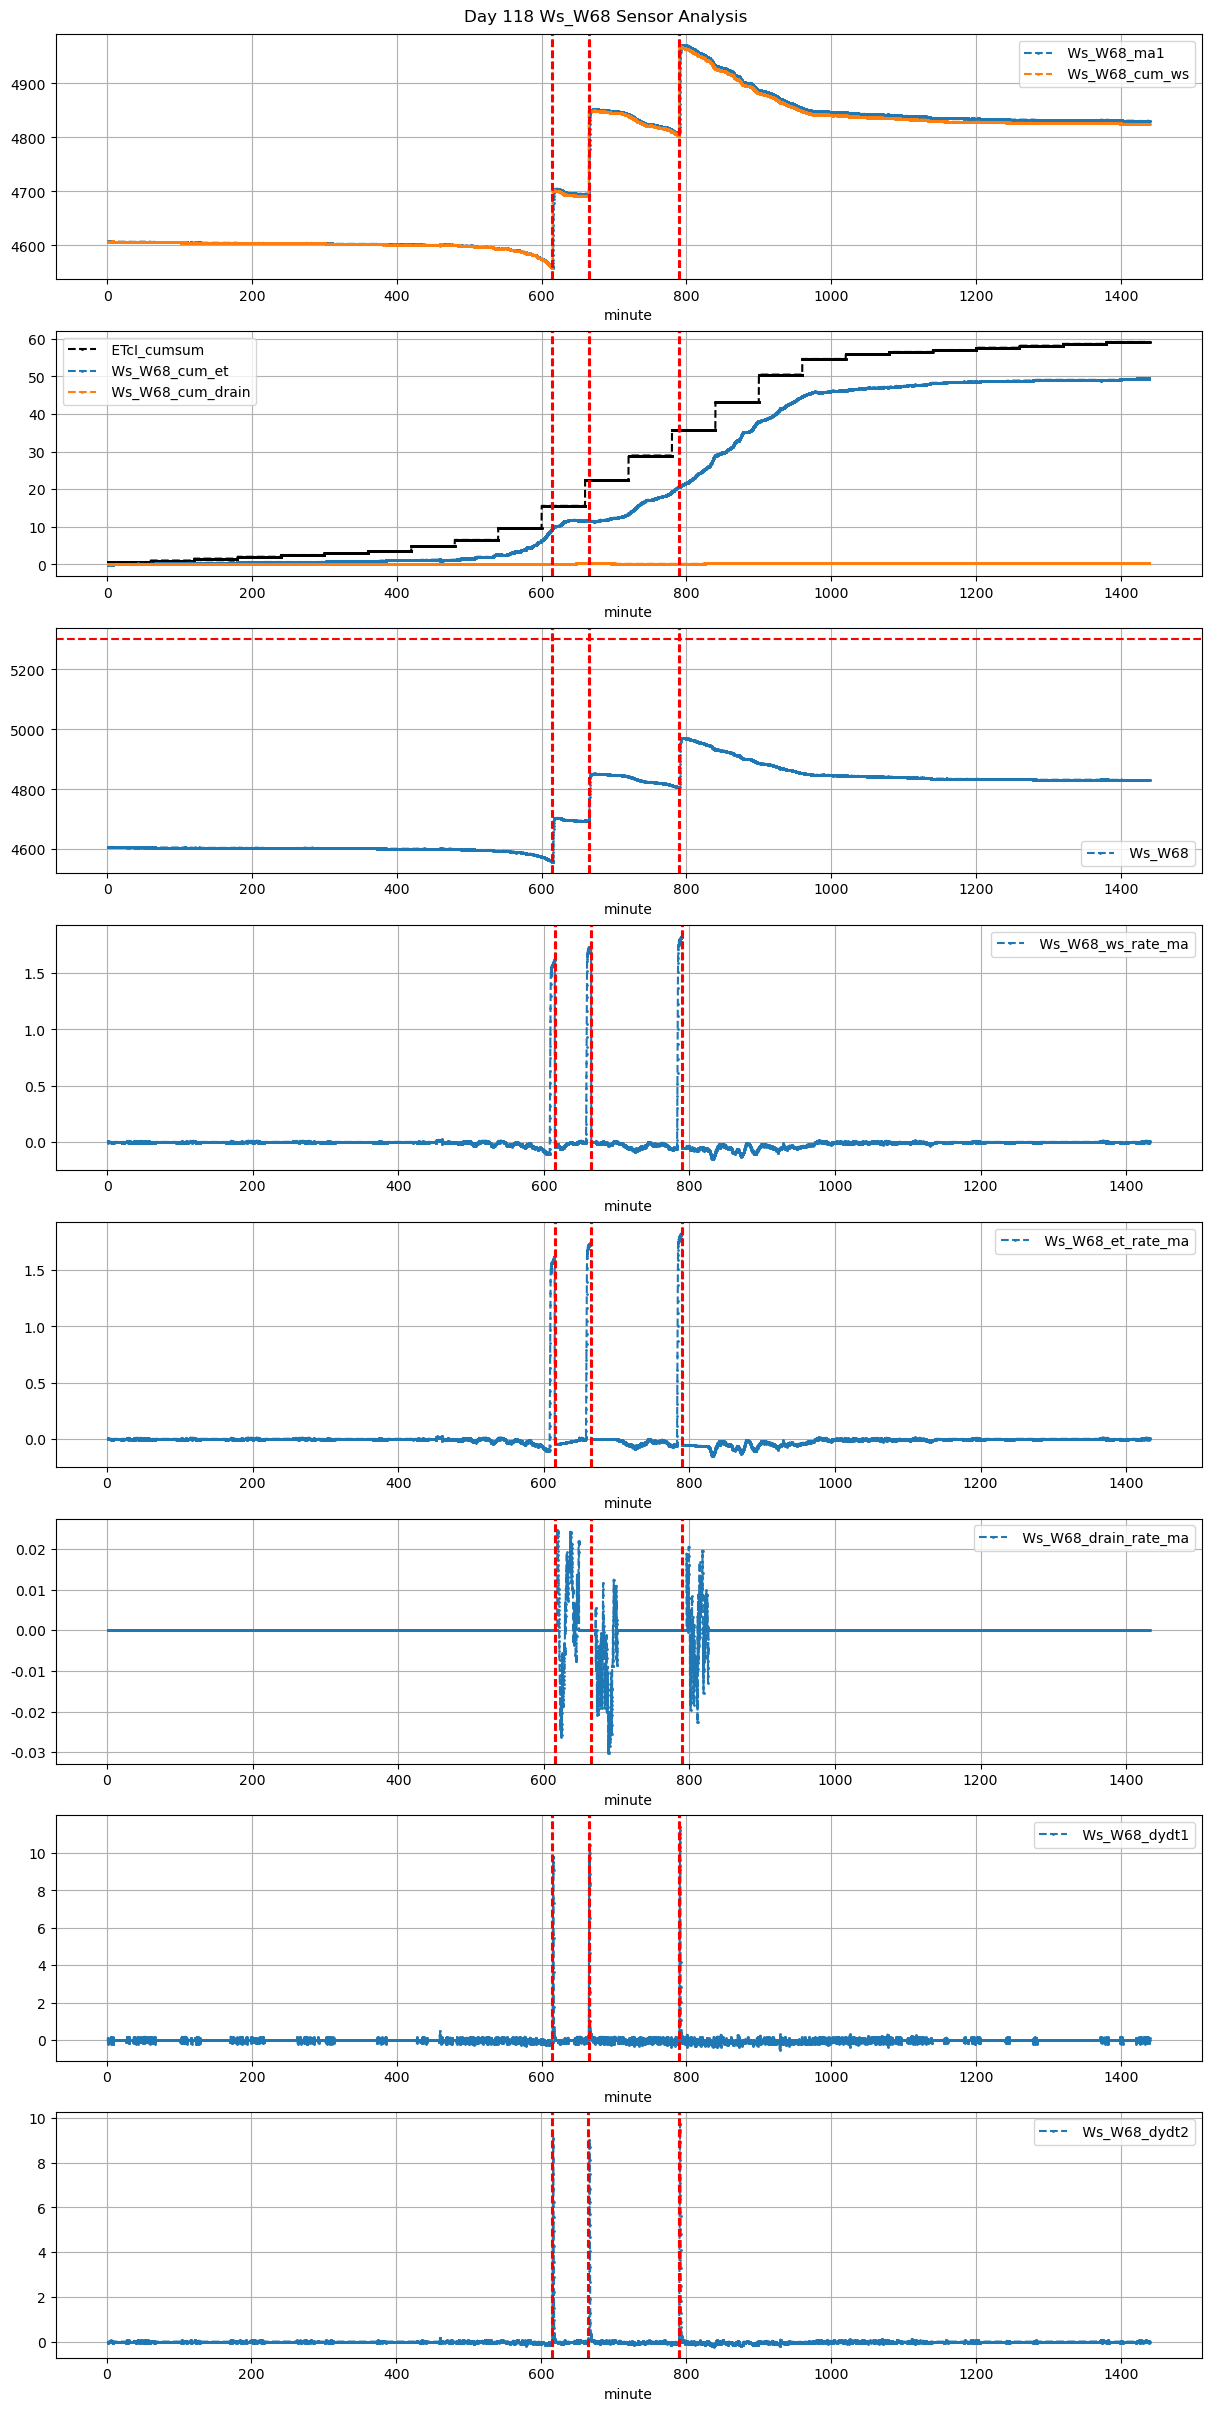
| 2026-02-01 10:15:00+08:00 |
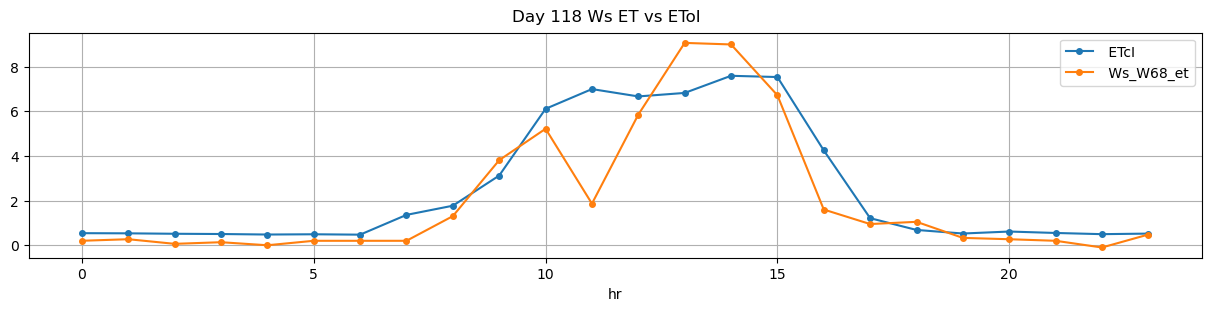
118 |
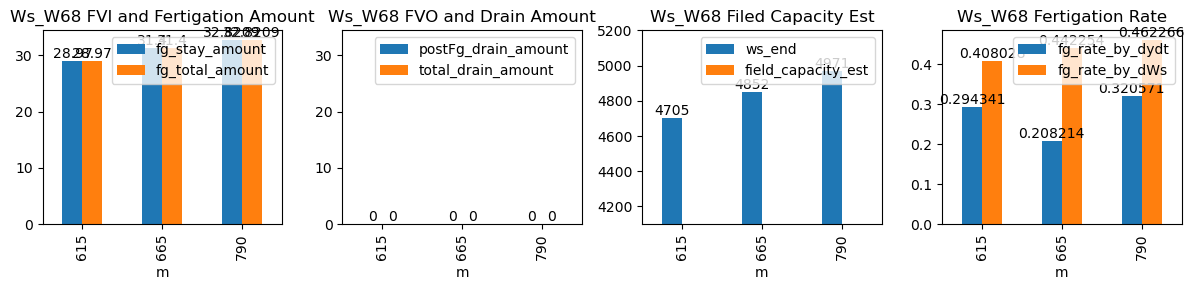
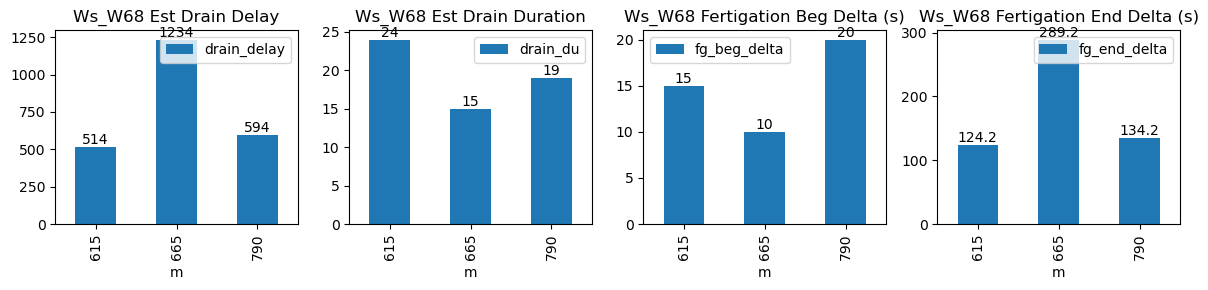
615 |
Ws_W68 |
0.16448 |
30 |
615.0 |
615.250000 |
616.18 |
618.250000 |
4560.150000 |
4705.0 |
71 |
-0.099131 |
-0.031242 |
-0.015556 |
0.294341 |
0.408028 |
28.970000 |
True |
15.0 |
124.2 |
28.970000 |
0.0 |
0 |
0.0 |
24 |
514 |
-0.131054 |
NaN |
| 2026-02-01 11:05:00+08:00 |
118 |
665 |
Ws_W68 |
0.16448 |
30 |
665.0 |
665.166667 |
666.18 |
671.000000 |
4695.000000 |
4852.0 |
71 |
-0.006073 |
-0.007715 |
0.000000 |
0.208214 |
0.442254 |
31.400000 |
True |
10.0 |
289.2 |
31.400000 |
0.0 |
0 |
0.0 |
15 |
1234 |
-0.181065 |
NaN |
| 2026-02-01 13:10:00+08:00 |
118 |
790 |
Ws_W68 |
0.16448 |
30 |
790.0 |
790.333333 |
791.18 |
793.416667 |
4806.895556 |
4971.0 |
71 |
-0.059370 |
-0.021910 |
-0.068069 |
0.320571 |
0.462266 |
32.820889 |
True |
20.0 |
134.2 |
32.820889 |
0.0 |
0 |
0.0 |
19 |
594 |
-0.191034 |
NaN |