| 2026-02-02 09:40:00+08:00 |
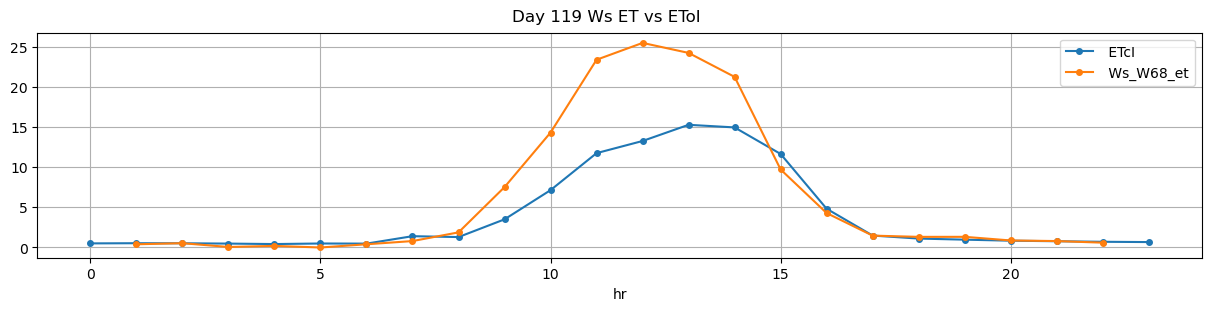
119 |
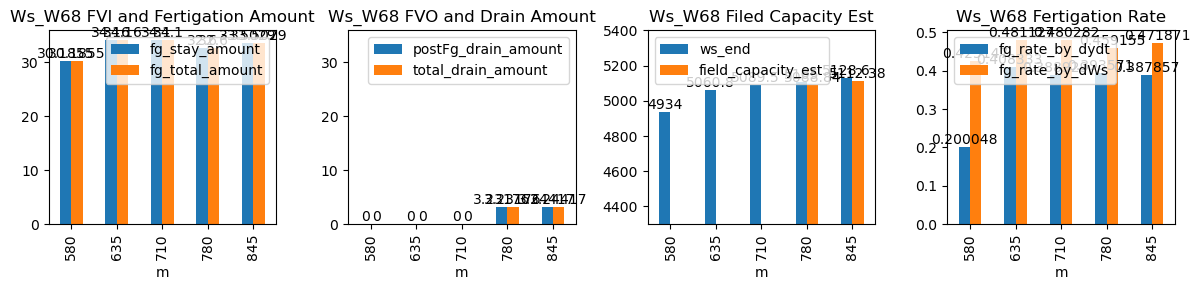
580 |
Ws_W68 |
0.447868 |
30 |
580.0 |
580.166667 |
581.18 |
585.916667 |
4783.072727 |
4934.0 |
71 |
-0.054141 |
-0.057738 |
-0.102624 |
0.200048 |
0.425147 |
30.185455 |
True |
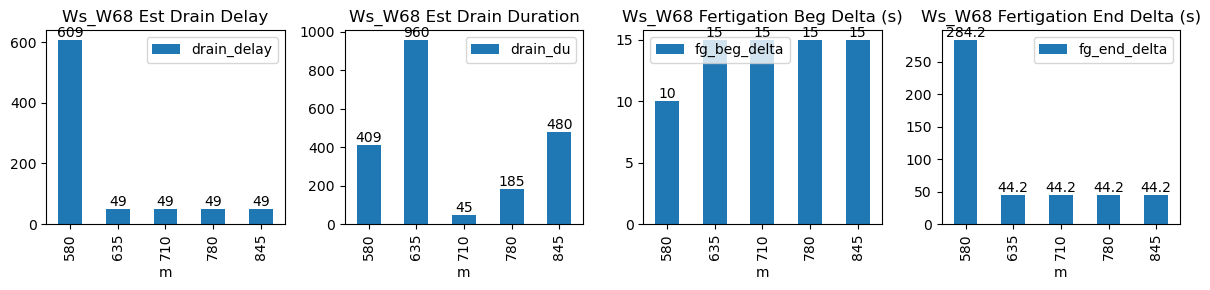
10.0 |
284.2 |
30.185455 |
0.0 |
0.000000 |
0.000000 |
409 |
609 |
-0.027592 |
NaN |
| 2026-02-02 10:35:00+08:00 |
119 |
635 |
Ws_W68 |
0.447868 |
30 |
635.0 |
635.250000 |
636.18 |
636.916667 |
4890.000000 |
5060.8 |
71 |
-0.088292 |
-0.163426 |
-0.144598 |
0.408333 |
0.481127 |
34.160000 |
True |
15.0 |
44.2 |
34.160000 |
0.0 |
0.000000 |
0.000000 |
960 |
49 |
-0.093624 |
NaN |
| 2026-02-02 11:50:00+08:00 |
119 |
710 |
Ws_W68 |
0.447868 |
30 |
710.0 |
710.250000 |
711.18 |
711.916667 |
4919.000000 |
5089.5 |
71 |
-0.161800 |
-0.167068 |
-0.085343 |
0.388929 |
0.480282 |
34.100000 |
True |
15.0 |
44.2 |
34.100000 |
0.0 |
0.000000 |
0.000000 |
45 |
49 |
-0.104960 |
NaN |
| 2026-02-02 13:00:00+08:00 |
119 |
780 |
Ws_W68 |
0.447868 |
30 |
780.0 |
780.250000 |
781.18 |
781.916667 |
4942.000000 |
5105.0 |
71 |
-0.177856 |
-0.202855 |
-0.162994 |
0.393571 |
0.459155 |
32.600000 |
True |
15.0 |
44.2 |
32.600000 |
0.0 |
3.231764 |
3.231764 |
185 |
49 |
-0.079068 |
5088.841178 |
| 2026-02-02 14:05:00+08:00 |
119 |
845 |
Ws_W68 |
0.447868 |
30 |
845.0 |
845.250000 |
846.18 |
846.916667 |
4961.085714 |
5128.6 |
71 |
-0.152661 |
-0.196879 |
-0.170617 |
0.387857 |
0.471871 |
33.502857 |
True |
15.0 |
44.2 |
33.502857 |
0.0 |
3.244168 |
3.244168 |
480 |
49 |
-0.089026 |
5112.379161 |