| 2026-02-03 09:10:00+08:00 |
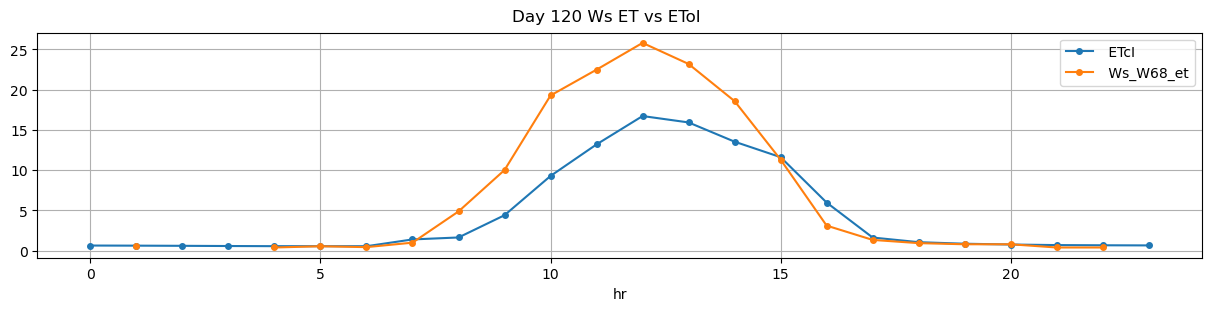
120 |
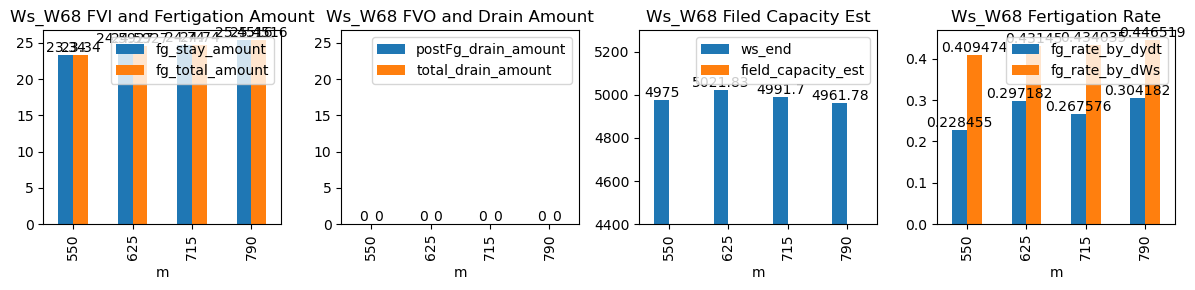
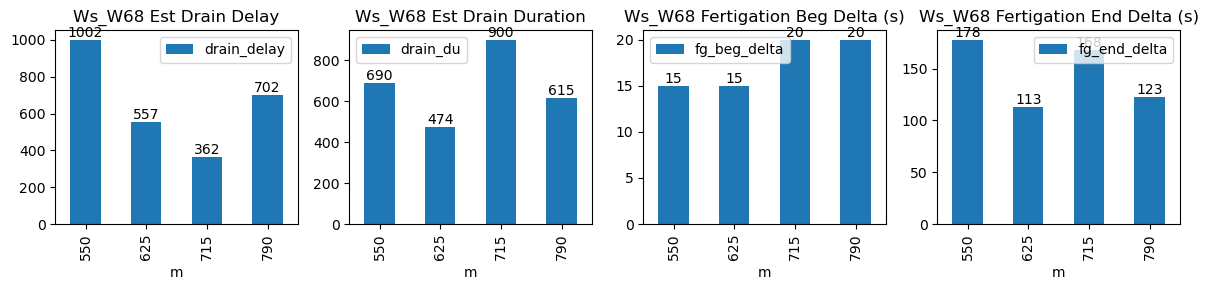
550 |
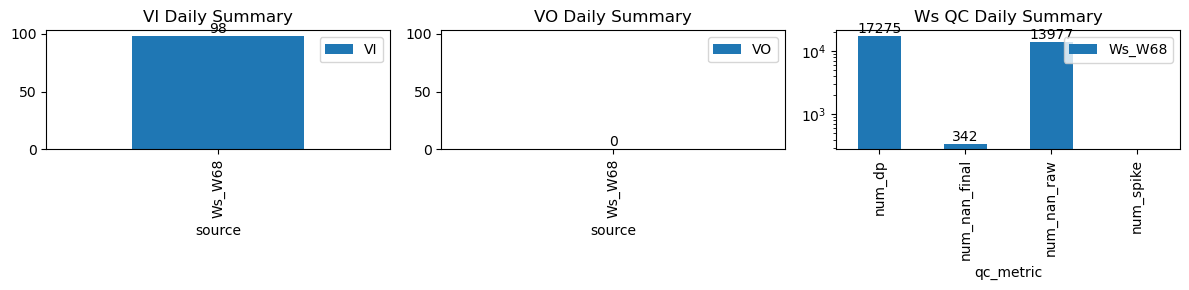
Ws_W68 |
0.363015 |
30 |
550.0 |
550.250000 |
550.95 |
553.916667 |
4858.300000 |
4975.000000 |
57 |
-0.071192 |
-0.041949 |
-0.100865 |
0.228455 |
0.409474 |
23.340000 |
True |
15.0 |
178.0 |
23.340000 |
0.0 |
0.0 |
0.0 |
690 |
1002 |
-0.013979 |
NaN |
| 2026-02-03 10:25:00+08:00 |
120 |
625 |
Ws_W68 |
0.363015 |
30 |
625.0 |
625.250000 |
625.95 |
627.833333 |
4898.866667 |
5021.830000 |
57 |
-0.134262 |
-0.124198 |
-0.163627 |
0.297182 |
0.431450 |
24.592667 |
True |
15.0 |
113.0 |
24.592667 |
0.0 |
0.0 |
0.0 |
474 |
557 |
-0.031663 |
NaN |
| 2026-02-03 11:55:00+08:00 |
120 |
715 |
Ws_W68 |
0.363015 |
30 |
715.0 |
715.333333 |
715.95 |
718.750000 |
4868.000000 |
4991.700000 |
57 |
-0.174417 |
-0.198457 |
-0.177641 |
0.267576 |
0.434035 |
24.740000 |
True |
20.0 |
168.0 |
24.740000 |
0.0 |
0.0 |
0.0 |
900 |
362 |
-0.045400 |
NaN |
| 2026-02-03 13:10:00+08:00 |
120 |
790 |
Ws_W68 |
0.363015 |
30 |
790.0 |
790.333333 |
790.95 |
793.000000 |
4834.520000 |
4961.777778 |
57 |
-0.201072 |
-0.173212 |
-0.181444 |
0.304182 |
0.446519 |
25.451556 |
True |
20.0 |
123.0 |
25.451556 |
0.0 |
0.0 |
0.0 |
615 |
702 |
-0.042265 |
NaN |