| 2026-02-28 08:05:00+08:00 |
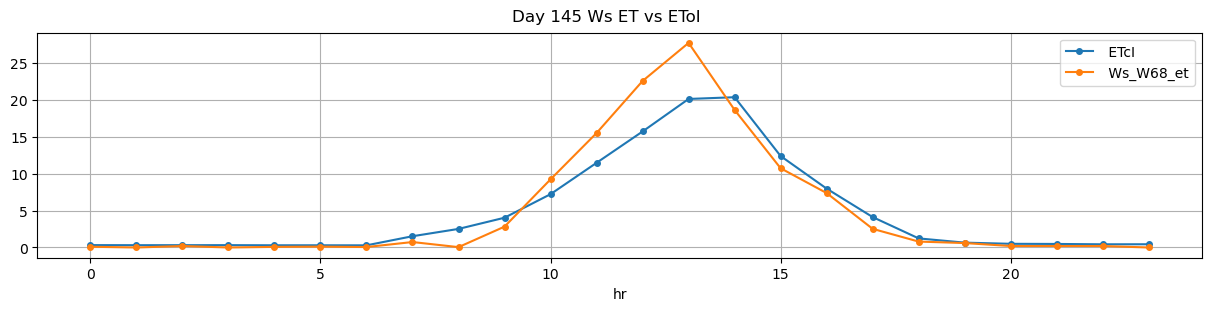
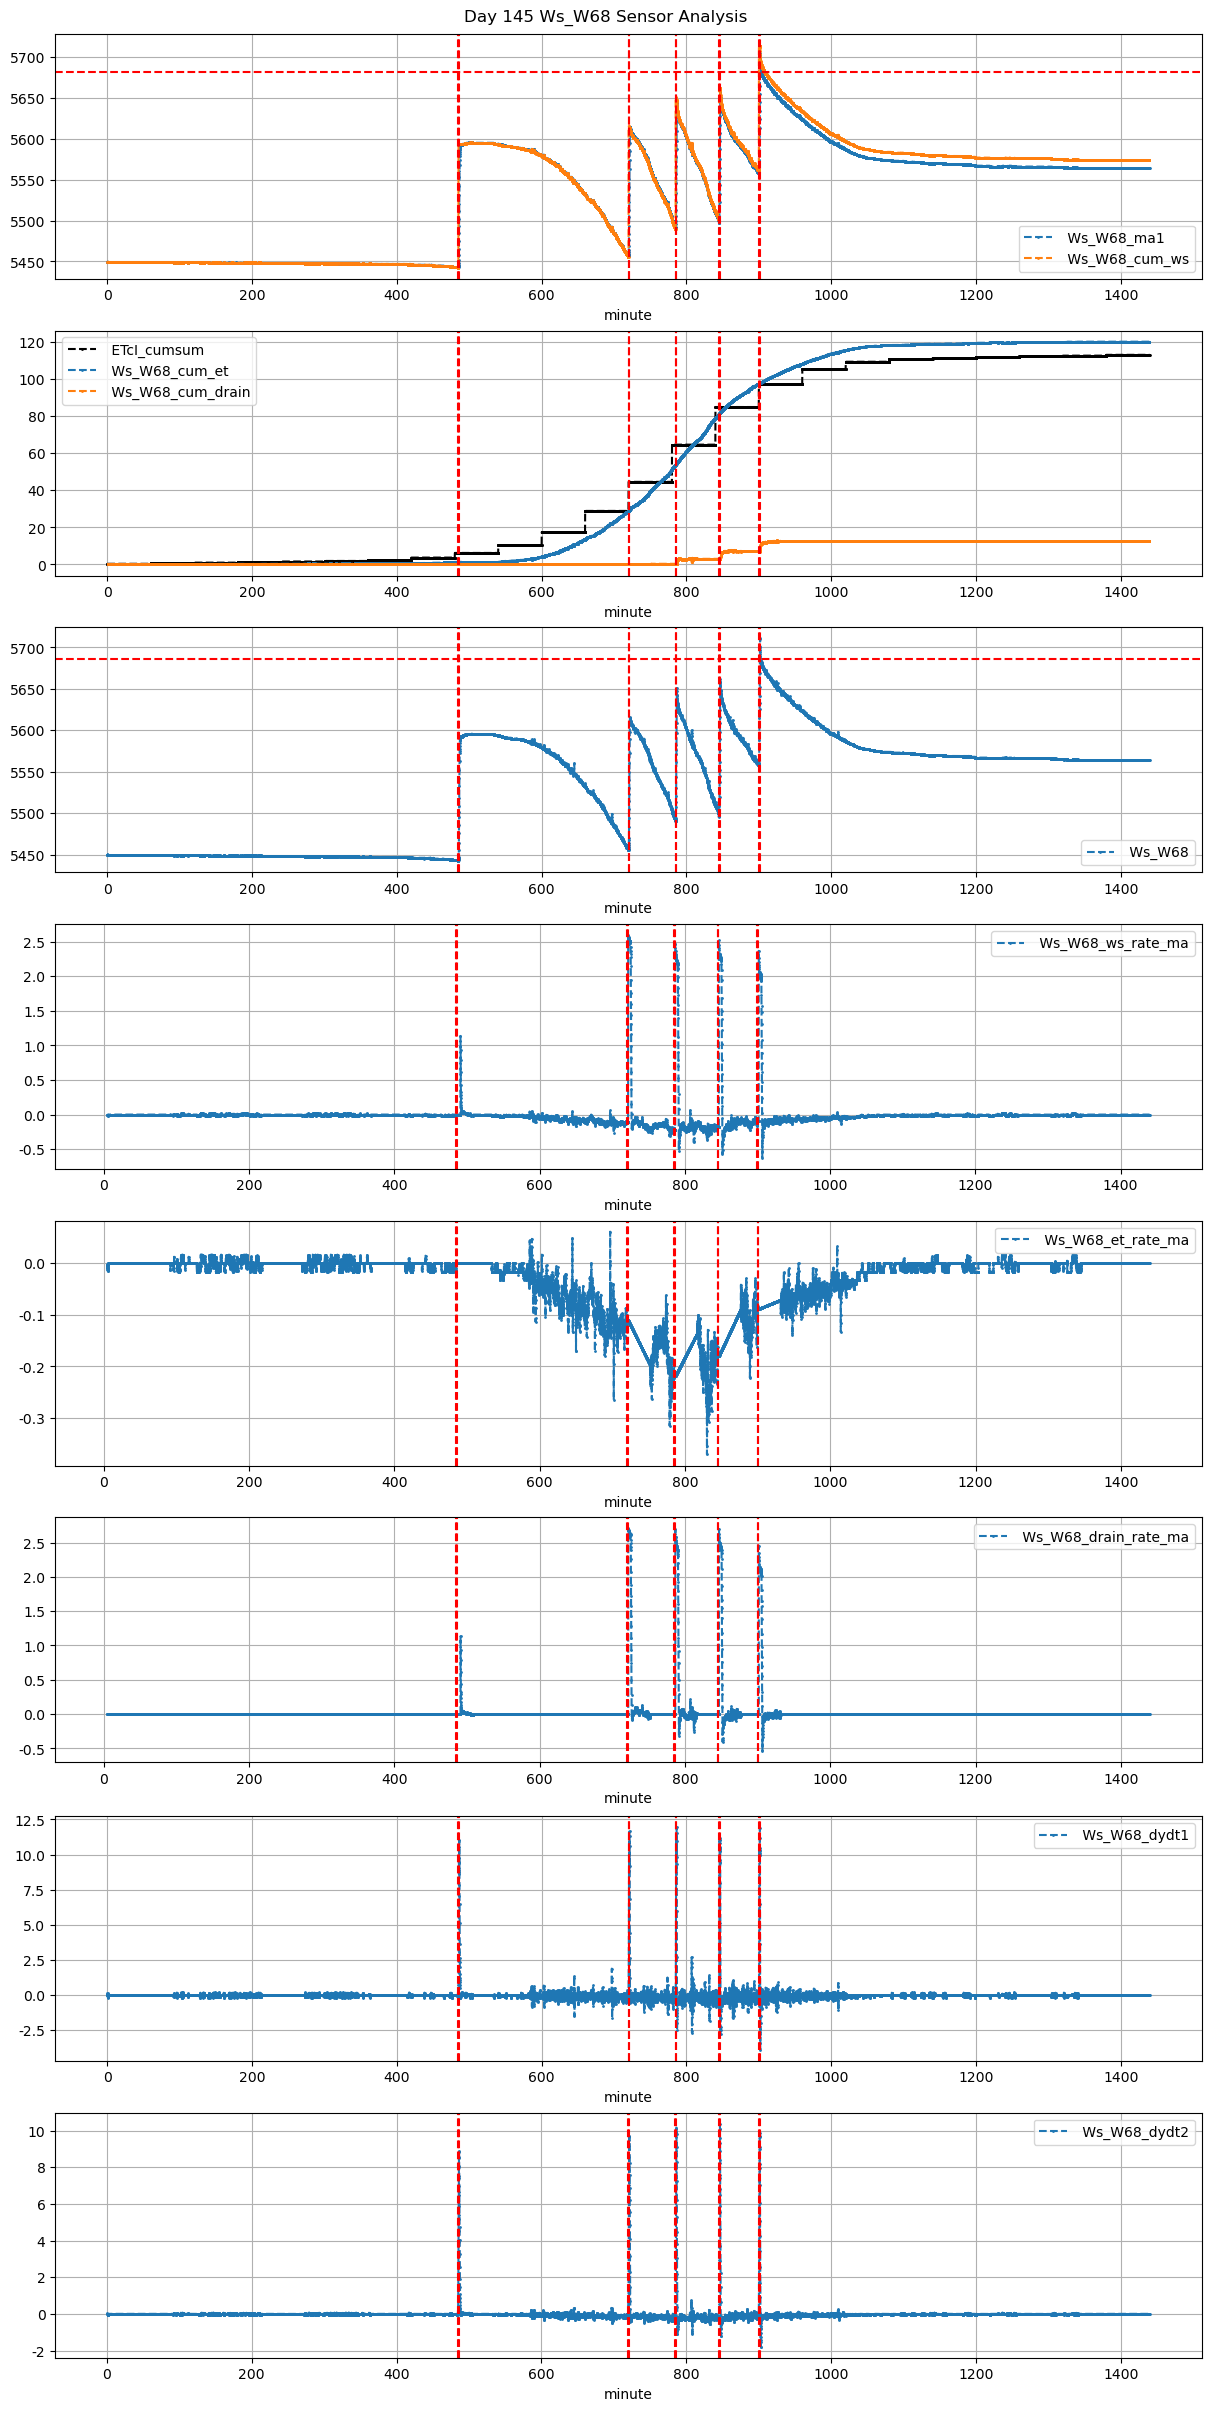
145 |
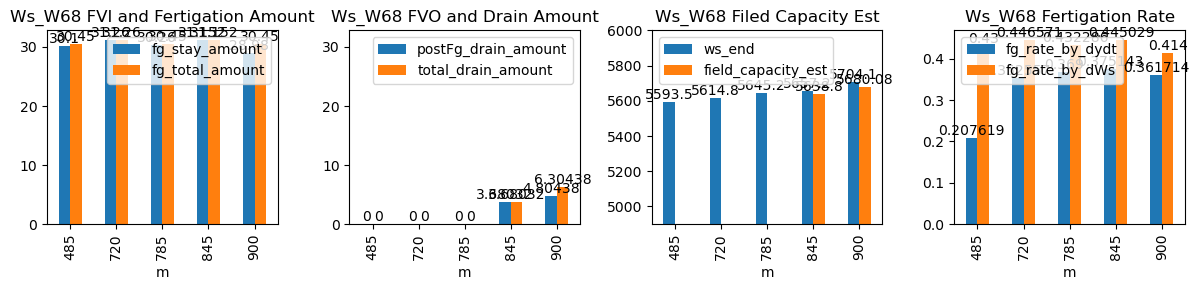
485 |
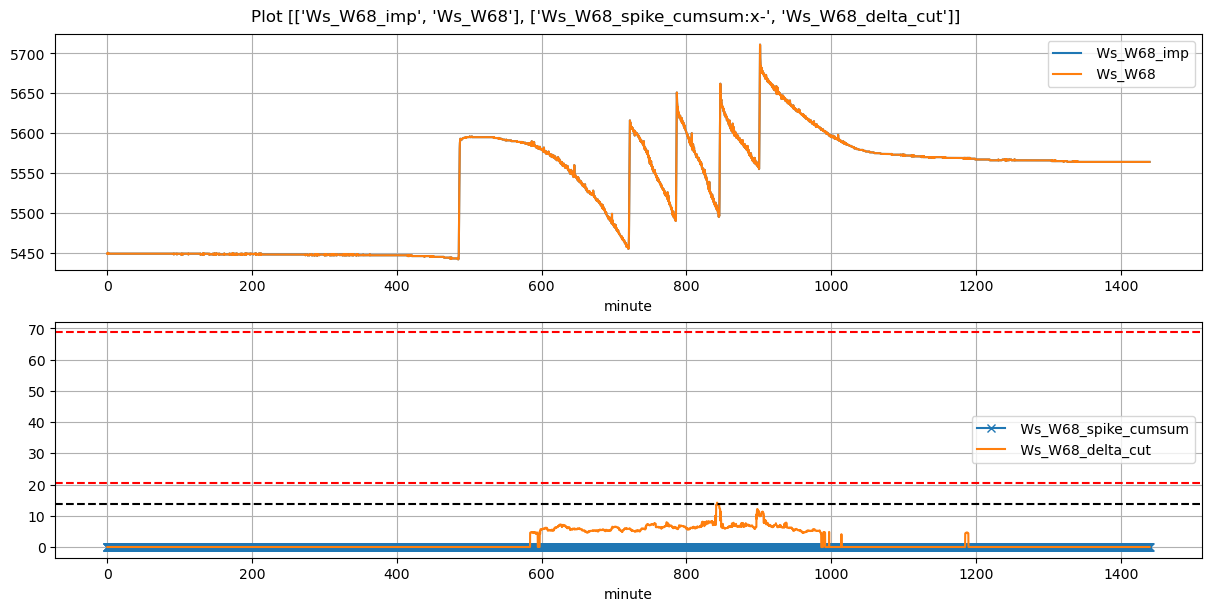
Ws_W68 |
0.433281 |
30 |
485.0 |
485.25 |
486.17 |
491.083333 |
5443.000000 |
5593.5 |
70 |
-0.003602 |
0.000000 |
0.000000 |
0.207619 |
0.430000 |
30.100000 |
True |
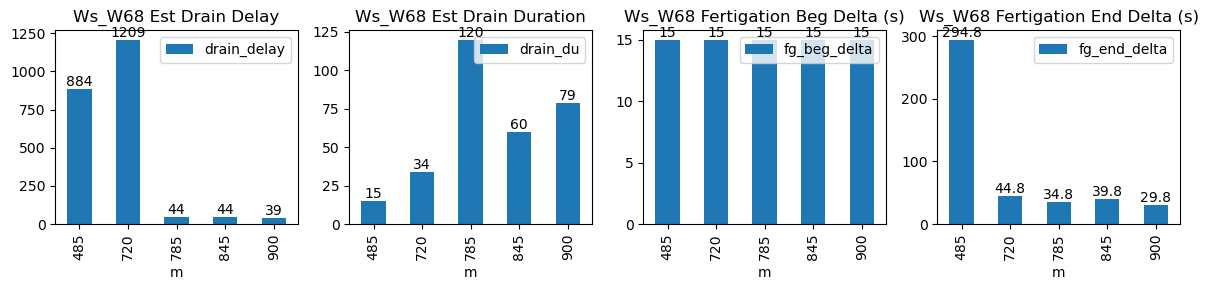
15.0 |
294.8 |
30.450000 |
0.0 |
0.000000 |
0.000000 |
15 |
884 |
-0.190985 |
NaN |
| 2026-02-28 12:00:00+08:00 |
145 |
720 |
Ws_W68 |
0.433281 |
30 |
720.0 |
720.25 |
721.17 |
721.916667 |
5458.000000 |
5616.0 |
70 |
-0.121575 |
-0.111042 |
-0.196667 |
0.359643 |
0.451429 |
31.600000 |
True |
15.0 |
44.8 |
31.600000 |
0.0 |
0.000000 |
0.000000 |
34 |
1209 |
-0.526569 |
NaN |
| 2026-02-28 13:05:00+08:00 |
145 |
785 |
Ws_W68 |
0.433281 |
30 |
785.0 |
785.25 |
786.17 |
786.750000 |
5492.657143 |
5651.0 |
70 |
-0.227731 |
-0.219051 |
-0.136250 |
0.373000 |
0.452408 |
31.668571 |
True |
15.0 |
34.8 |
31.668571 |
0.0 |
2.608597 |
2.608597 |
120 |
44 |
-0.985315 |
NaN |
| 2026-02-28 14:05:00+08:00 |
145 |
845 |
Ws_W68 |
0.433281 |
30 |
845.0 |
845.25 |
846.17 |
846.833333 |
5500.500000 |
5662.0 |
70 |
-0.179520 |
-0.255556 |
-0.089167 |
0.375143 |
0.461429 |
32.300000 |
True |
15.0 |
39.8 |
32.300000 |
0.0 |
4.215749 |
4.215749 |
60 |
44 |
-0.904944 |
NaN |
| 2026-02-28 15:00:00+08:00 |
145 |
900 |
Ws_W68 |
0.433281 |
30 |
900.0 |
900.25 |
901.17 |
901.666667 |
5559.000000 |
5711.0 |
70 |
-0.088500 |
-0.167500 |
-0.071134 |
0.362214 |
0.434286 |
30.400000 |
True |
15.0 |
29.8 |
30.450000 |
0.1 |
5.797081 |
5.897081 |
79 |
39 |
-0.859715 |
5682.014596 |