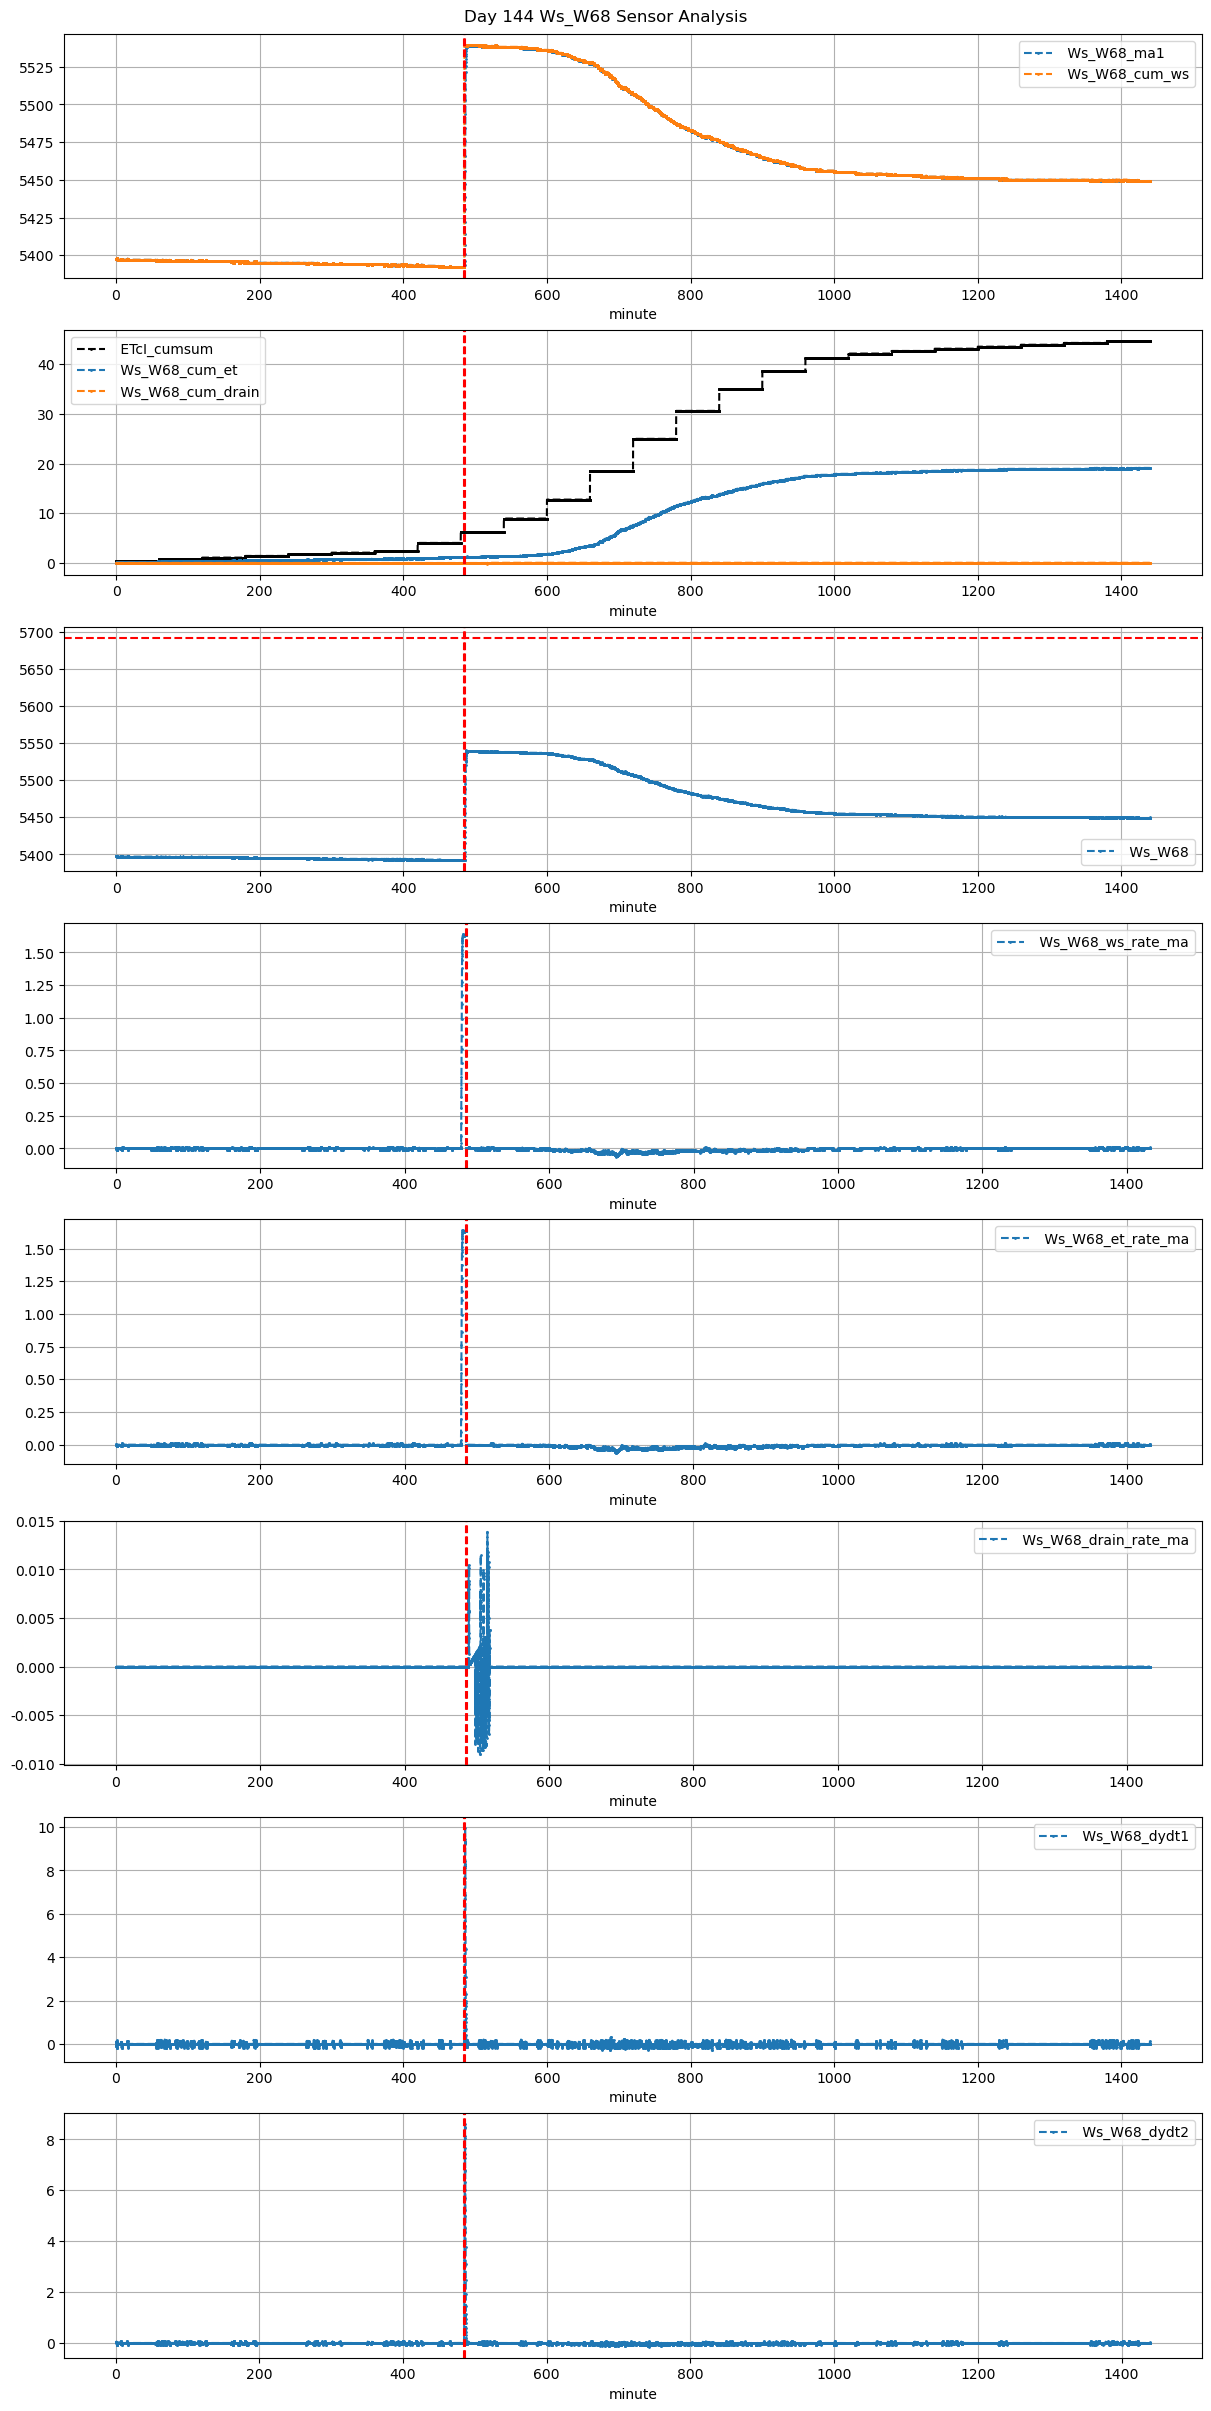
VI and VO Daily Summary
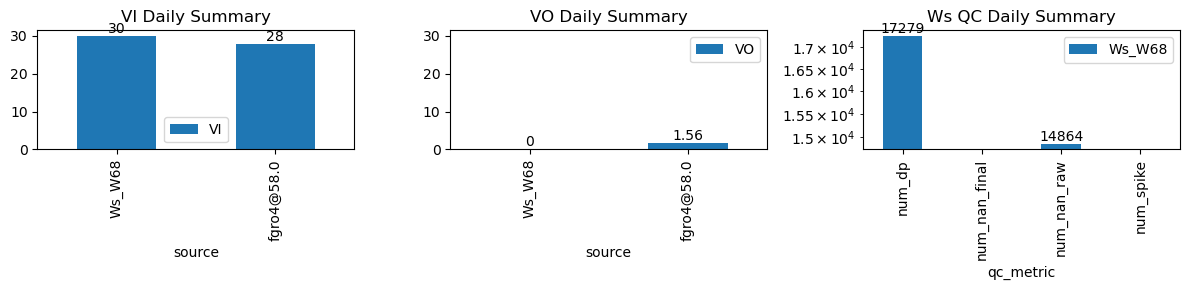
| ws_name | num_dp | num_nan_raw | num_nan_final | num_spike | cum_step_adj |
|---|---|---|---|---|---|
| Ws_W68 | 17,279 | 14,864 | 0 | 0 | 0.00 |
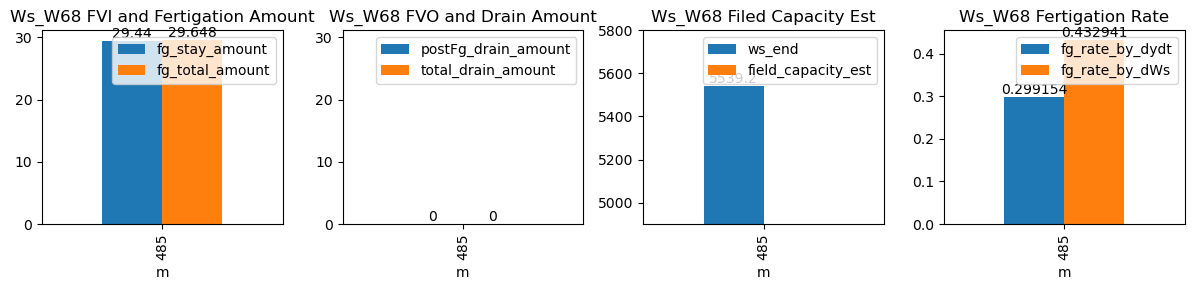
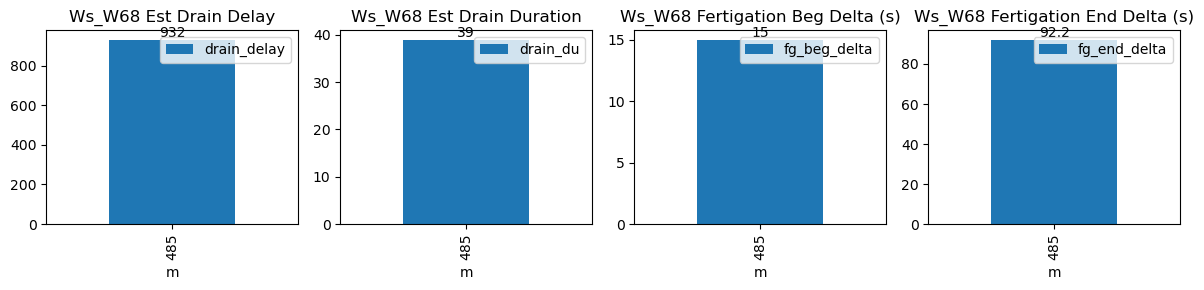
| ds | d | m | ws_name | prominence_cut | max_drain_du | fg_beg | fg_beg_est | fg_end | fg_end_est | ws_beg | ws_end | duc | pre_fg_et | post_fg_ws | post_drn_et | fg_rate_by_dydt | fg_rate_by_dWs | fg_stay_amount | enough_data | fg_beg_delta | fg_end_delta | fg_total_amount | fg_drain_amount | postFg_drain_amount | total_drain_amount | drain_du | drain_delay | drain_rate | field_capacity_est |
|---|---|---|---|---|---|---|---|---|---|---|---|---|---|---|---|---|---|---|---|---|---|---|---|---|---|---|---|---|---|
| 2026-02-27 08:05:00+08:00 | 144 | 485 | Ws_W68 | 0.101073 | 30 | 485.0 | 485.25 | 486.13 | 487.666667 | 5392.0 | 5539.2 | 68 | 0.0 | 0.0 | -0.003765 | 0.299154 | 0.432941 | 29.44 | True | 15.0 | 92.2 | 29.648 | 0.0 | 0 | 0.0 | 39 | 932 | -0.008592 | NaN |