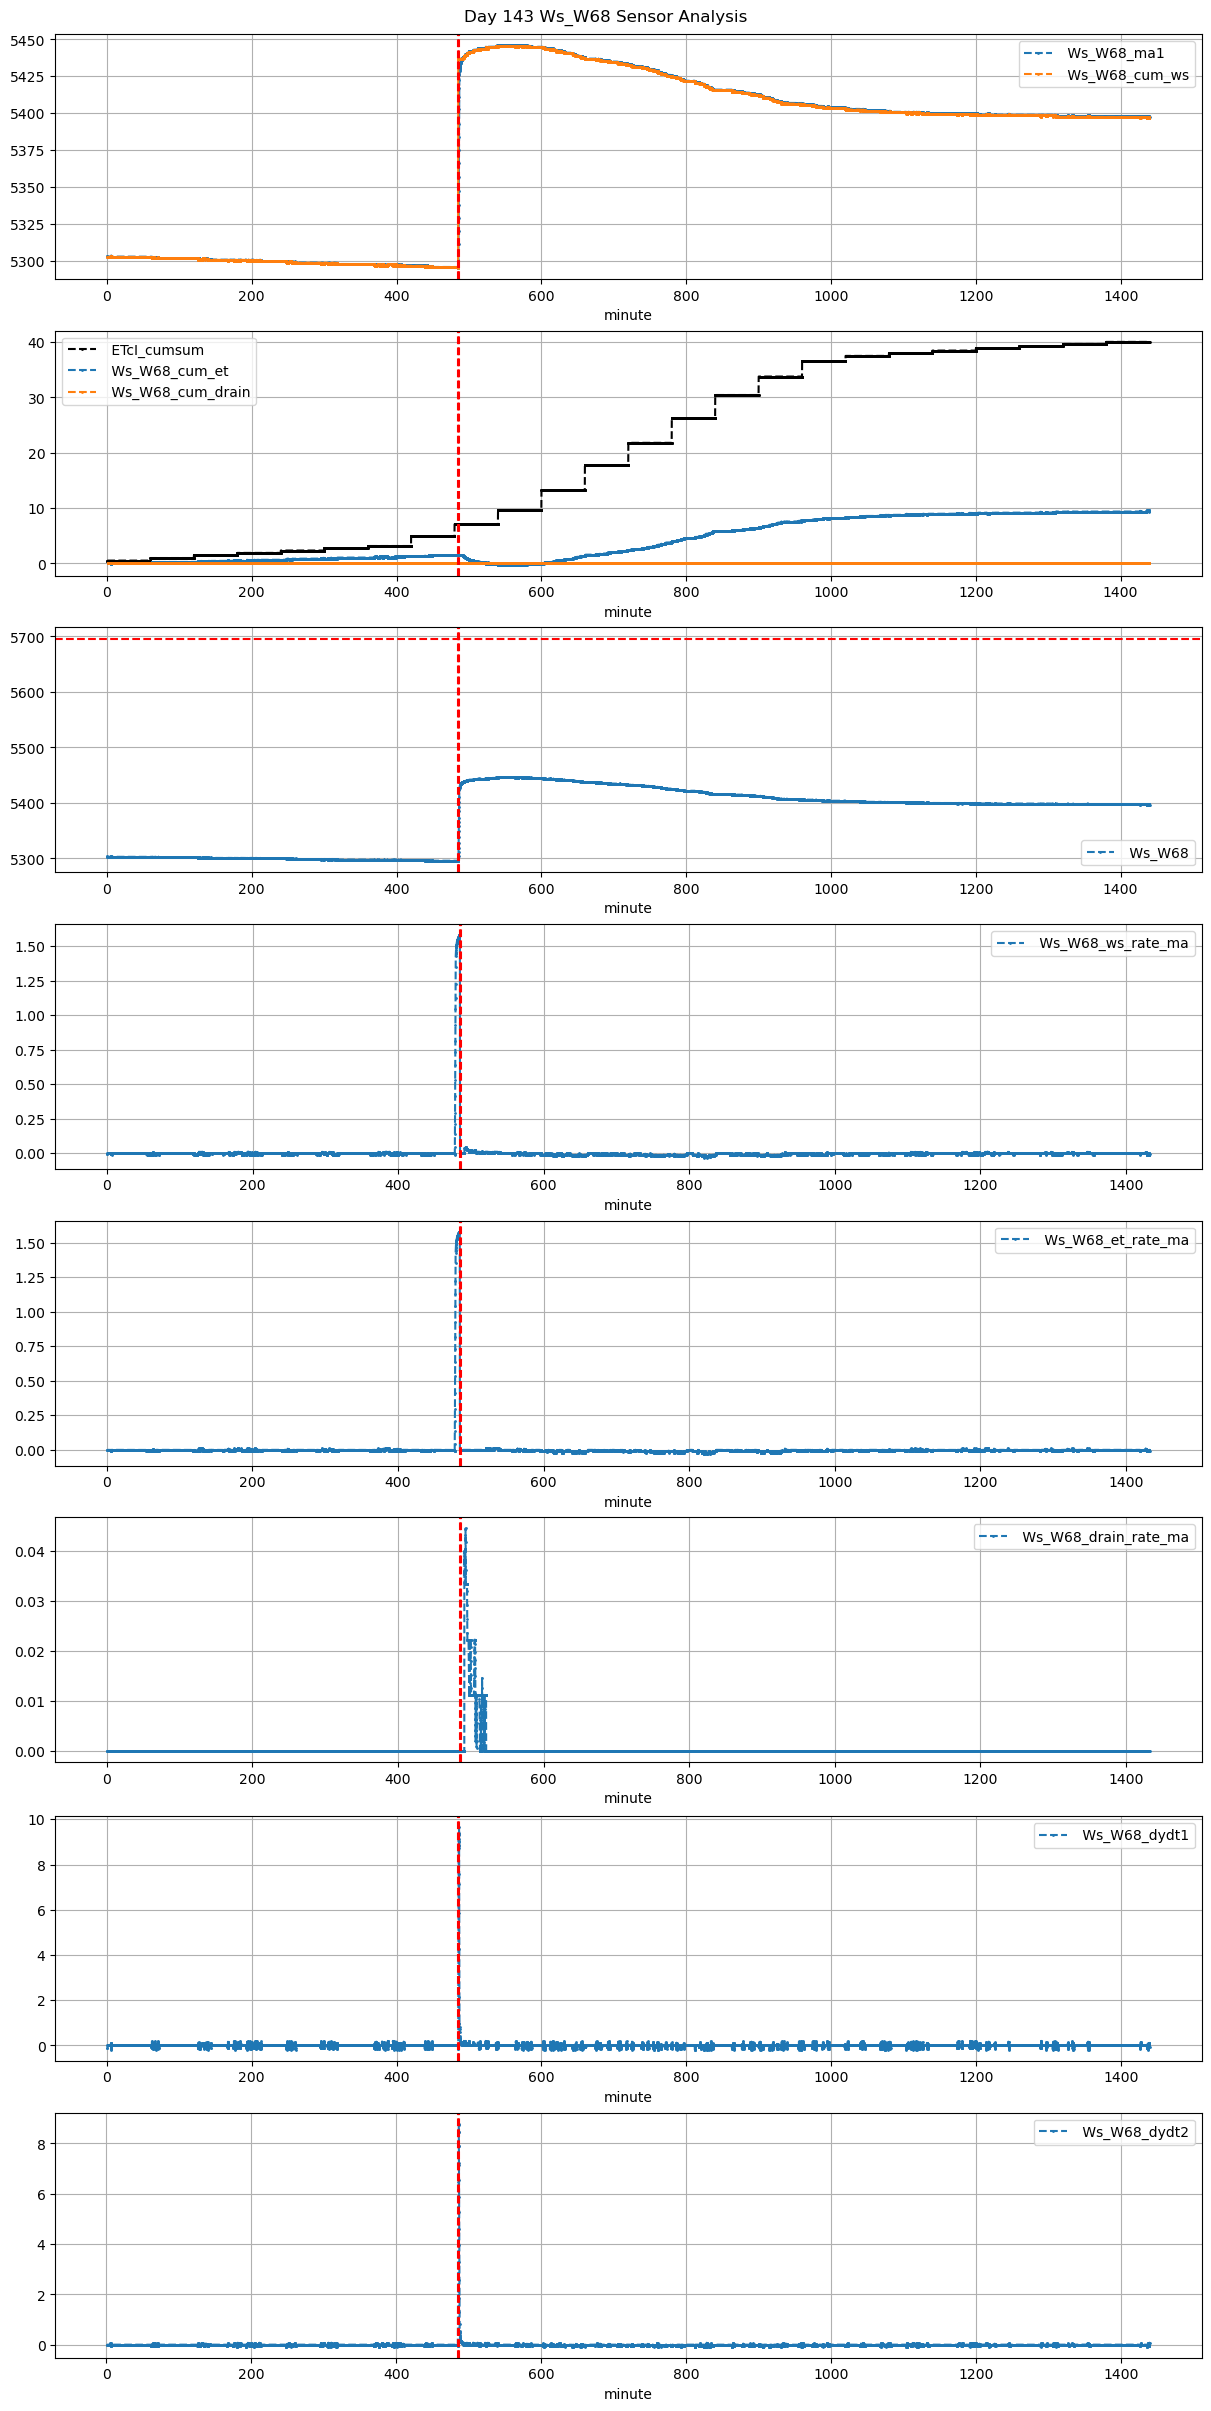
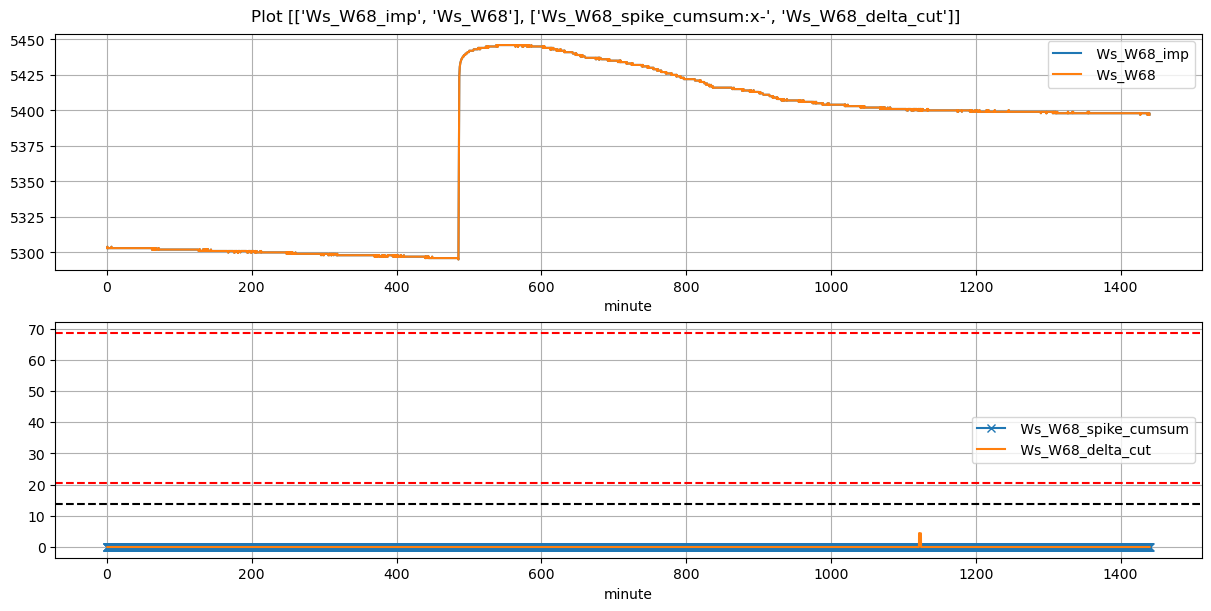
VI and VO Daily Summary
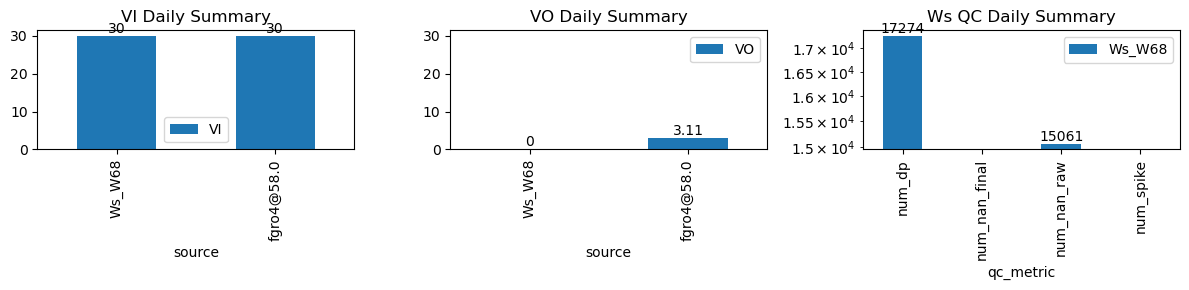
| ws_name | num_dp | num_nan_raw | num_nan_final | num_spike | cum_step_adj |
|---|---|---|---|---|---|
| Ws_W68 | 17,274 | 15,061 | 0 | 0 | 0.00 |
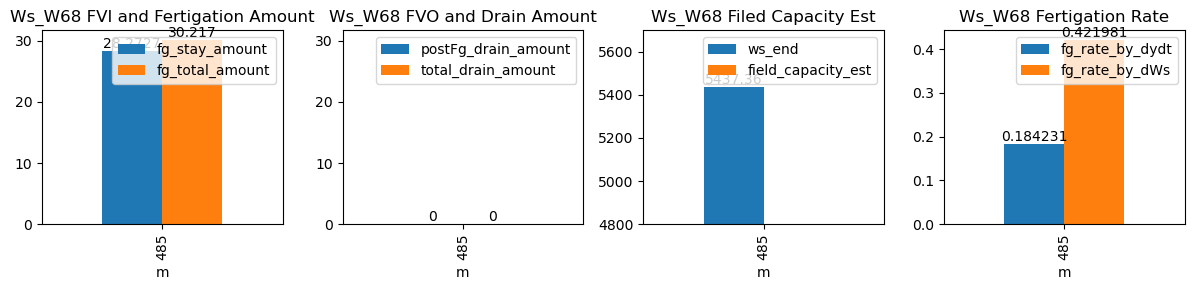
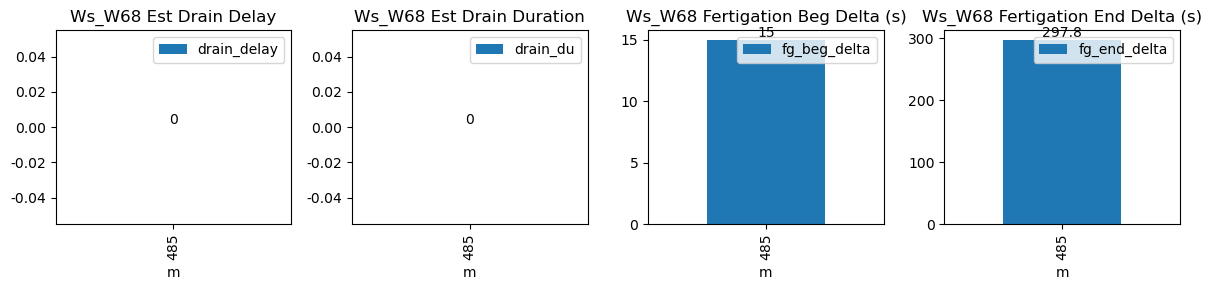
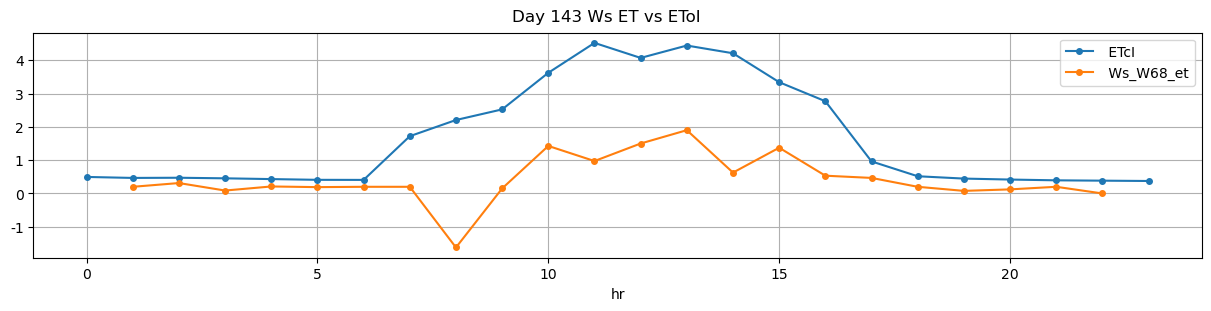
| ds | d | m | ws_name | prominence_cut | max_drain_du | fg_beg | fg_beg_est | fg_end | fg_end_est | ws_beg | ws_end | duc | pre_fg_et | post_fg_ws | post_drn_et | fg_rate_by_dydt | fg_rate_by_dWs | fg_stay_amount | enough_data | fg_beg_delta | fg_end_delta | fg_total_amount | fg_drain_amount | postFg_drain_amount | total_drain_amount | drain_du | drain_delay | drain_rate | field_capacity_est |
|---|---|---|---|---|---|---|---|---|---|---|---|---|---|---|---|---|---|---|---|---|---|---|---|---|---|---|---|---|---|
| 2026-02-26 08:05:00+08:00 | 143 | 485 | Ws_W68 | 0.080339 | 30 | 485.0 | 485.25 | 486.12 | 491.083333 | 5296.0 | 5437.363636 | 67 | -0.000036 | 0.0 | 0.0 | 0.184231 | 0.421981 | 28.272727 | True | 15.0 | 297.8 | 30.217 | 0.0 | 0 | 0.0 | NaN | NaN | NaN | NaN |