VI and VO Daily Summary
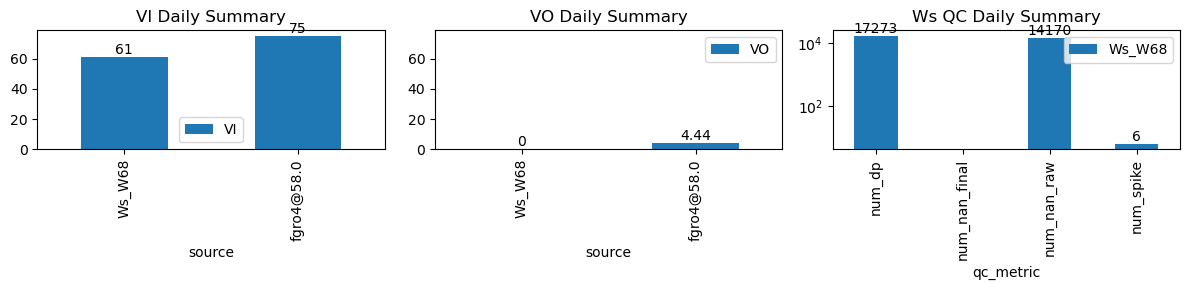
| ws_name | num_dp | num_nan_raw | num_nan_final | num_spike | cum_step_adj |
|---|---|---|---|---|---|
| Ws_W68 | 17,273 | 14,170 | 0 | 6 | 0.00 |
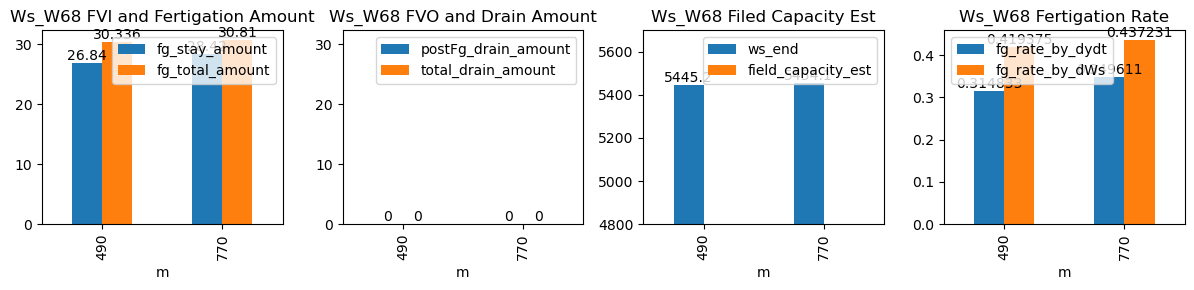
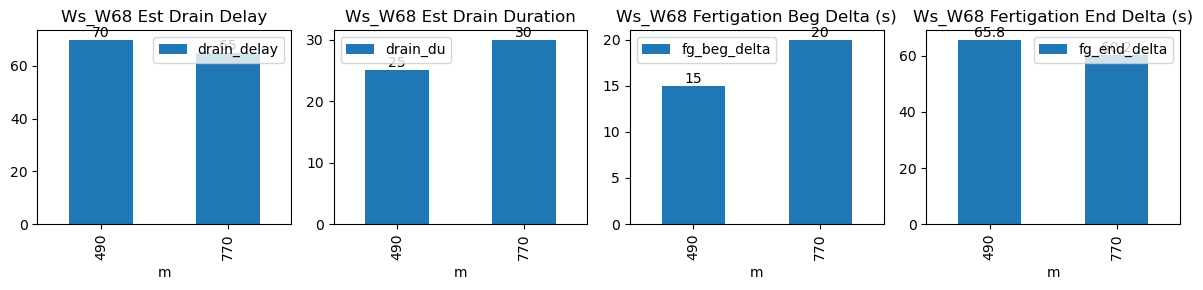
| ds | d | m | ws_name | prominence_cut | max_drain_du | fg_beg | fg_beg_est | fg_end | fg_end_est | ws_beg | ws_end | duc | pre_fg_et | post_fg_ws | post_drn_et | fg_rate_by_dydt | fg_rate_by_dWs | fg_stay_amount | enough_data | fg_beg_delta | fg_end_delta | fg_total_amount | fg_drain_amount | postFg_drain_amount | total_drain_amount | drain_du | drain_delay | drain_rate | field_capacity_est |
|---|---|---|---|---|---|---|---|---|---|---|---|---|---|---|---|---|---|---|---|---|---|---|---|---|---|---|---|---|---|
| 2026-02-25 08:10:00+08:00 | 142 | 490 | Ws_W68 | 0.195407 | 30 | 490.0 | 490.250000 | 491.07 | 492.166667 | 5311.0 | 5445.2 | 64 | -0.002417 | 0.000000 | -0.017023 | 0.314833 | 0.419375 | 26.84 | True | 15.0 | 65.8 | 30.336 | 0.0 | 0 | 0.0 | 25 | 70 | -0.009439 | NaN |
| 2026-02-25 12:50:00+08:00 | 142 | 770 | Ws_W68 | 0.195407 | 30 | 770.0 | 770.333333 | 771.08 | 772.083333 | 5312.0 | 5454.1 | 65 | -0.070371 | -0.061605 | -0.060288 | 0.349611 | 0.437231 | 28.42 | True | 20.0 | 60.2 | 30.810 | 0.0 | 0 | 0.0 | 30 | 65 | -0.038578 | NaN |