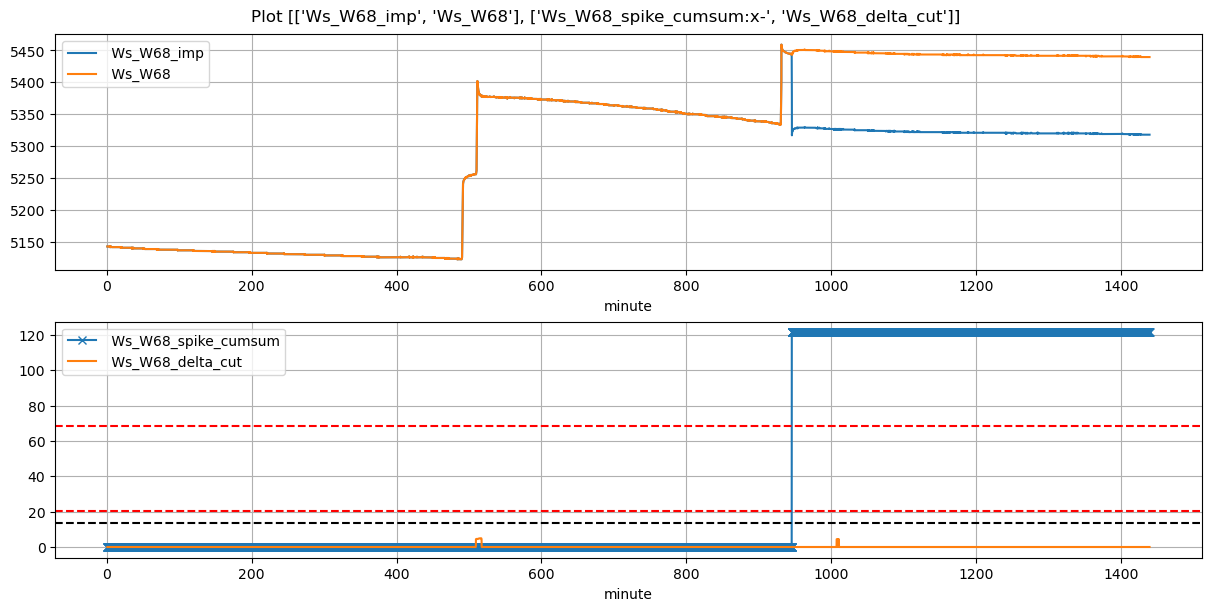
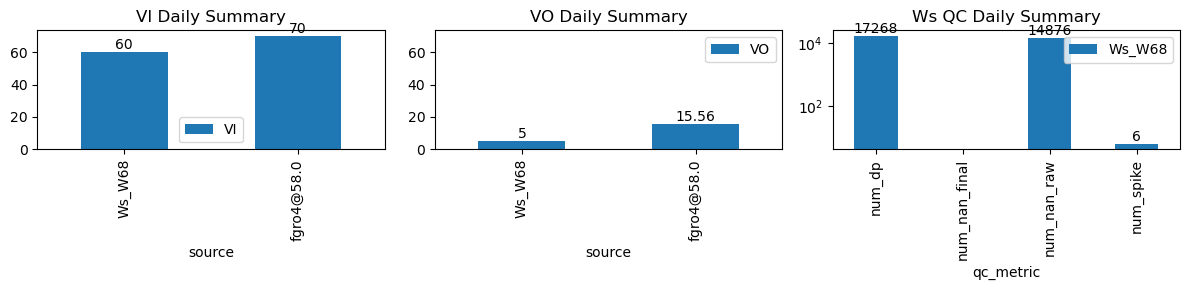
VI and VO Daily Summary
| ws_name | num_dp | num_nan_raw | num_nan_final | num_spike | cum_step_adj |
|---|---|---|---|---|---|
| Ws_W68 | 17,268 | 14,876 | 0 | 6 | 121.50 |
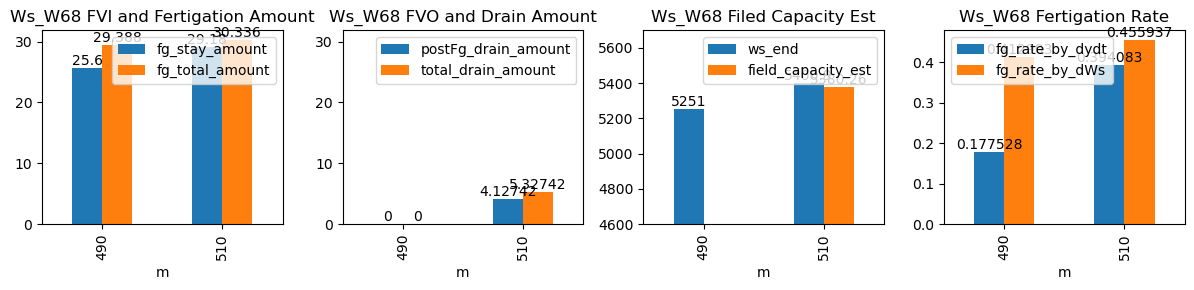
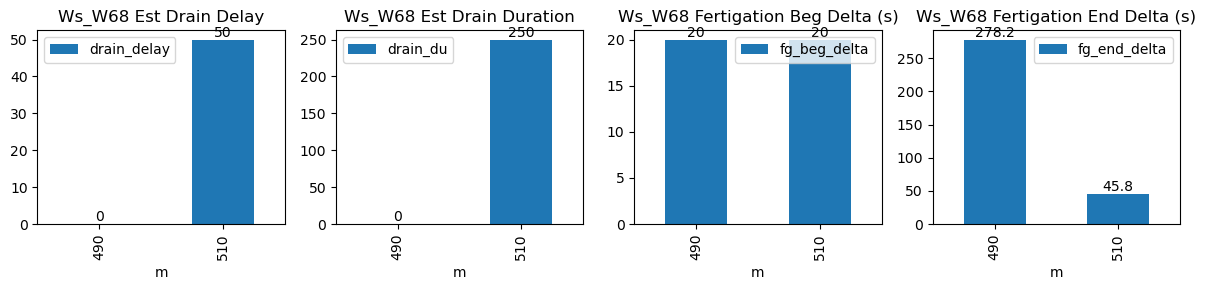
| ds | d | m | ws_name | prominence_cut | max_drain_du | fg_beg | fg_beg_est | fg_end | fg_end_est | ws_beg | ws_end | duc | pre_fg_et | post_fg_ws | post_drn_et | fg_rate_by_dydt | fg_rate_by_dWs | fg_stay_amount | enough_data | fg_beg_delta | fg_end_delta | fg_total_amount | fg_drain_amount | postFg_drain_amount | total_drain_amount | drain_du | drain_delay | drain_rate | field_capacity_est |
|---|---|---|---|---|---|---|---|---|---|---|---|---|---|---|---|---|---|---|---|---|---|---|---|---|---|---|---|---|---|
| 2026-02-24 08:10:00+08:00 | 141 | 490 | Ws_W68 | 0.170087 | 14.666667 | 490.0 | 490.333333 | 491.03 | 495.333333 | 5123.00 | 5251.0 | 62 | -0.007458 | 0.000000 | 0.000000 | 0.193472 | 0.412903 | 25.600 | True | 20.0 | 258.2 | 29.388 | 0.0 | 0.000000 | 0.000000 | 10 | 723 | -0.159167 | NaN |
| 2026-02-24 08:30:00+08:00 | 141 | 510 | Ws_W68 | 0.170087 | 30.000000 | 510.0 | 510.333333 | 511.07 | 511.666667 | 5255.34 | 5402.0 | 64 | 0.000000 | -0.121243 | -0.007475 | 0.395250 | 0.458312 | 29.332 | True | 20.0 | 35.8 | 30.336 | 0.0 | 4.414126 | 4.414126 | 204 | 55 | -0.934892 | NaN |