| 2026-03-31 07:25:00+08:00 |
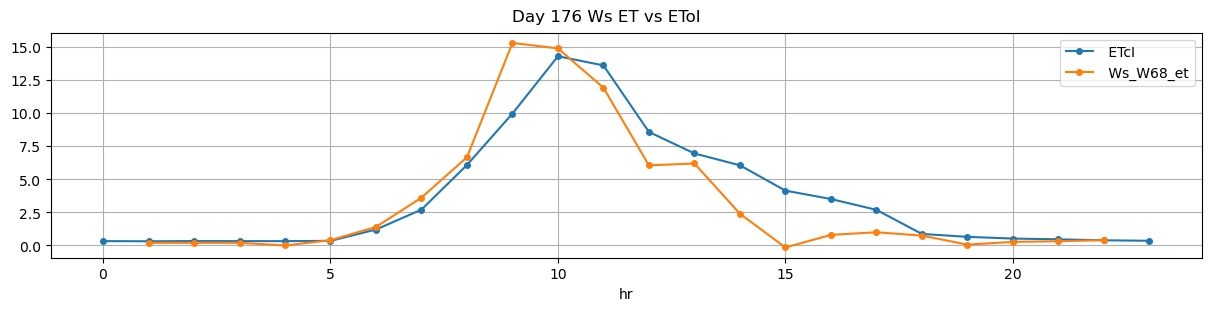
176 |
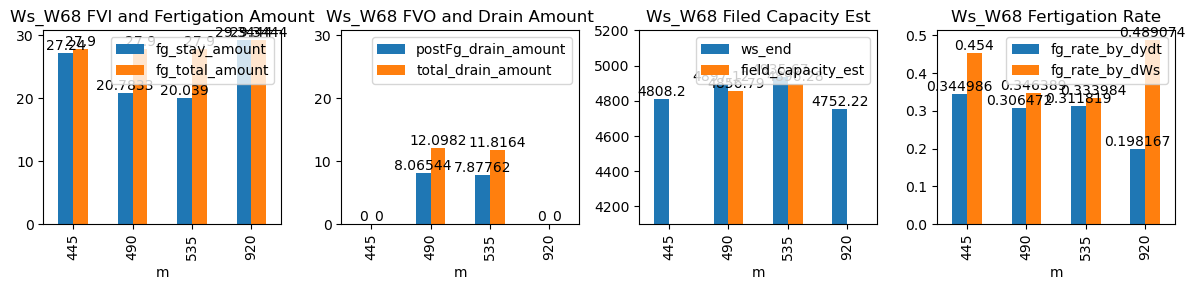
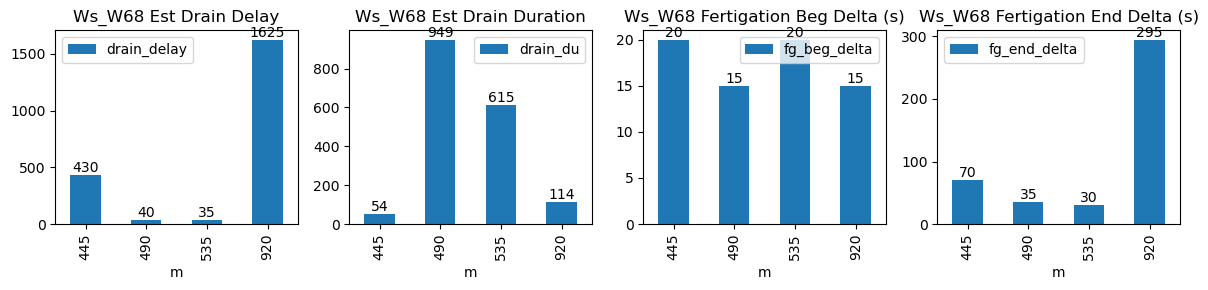
445 |
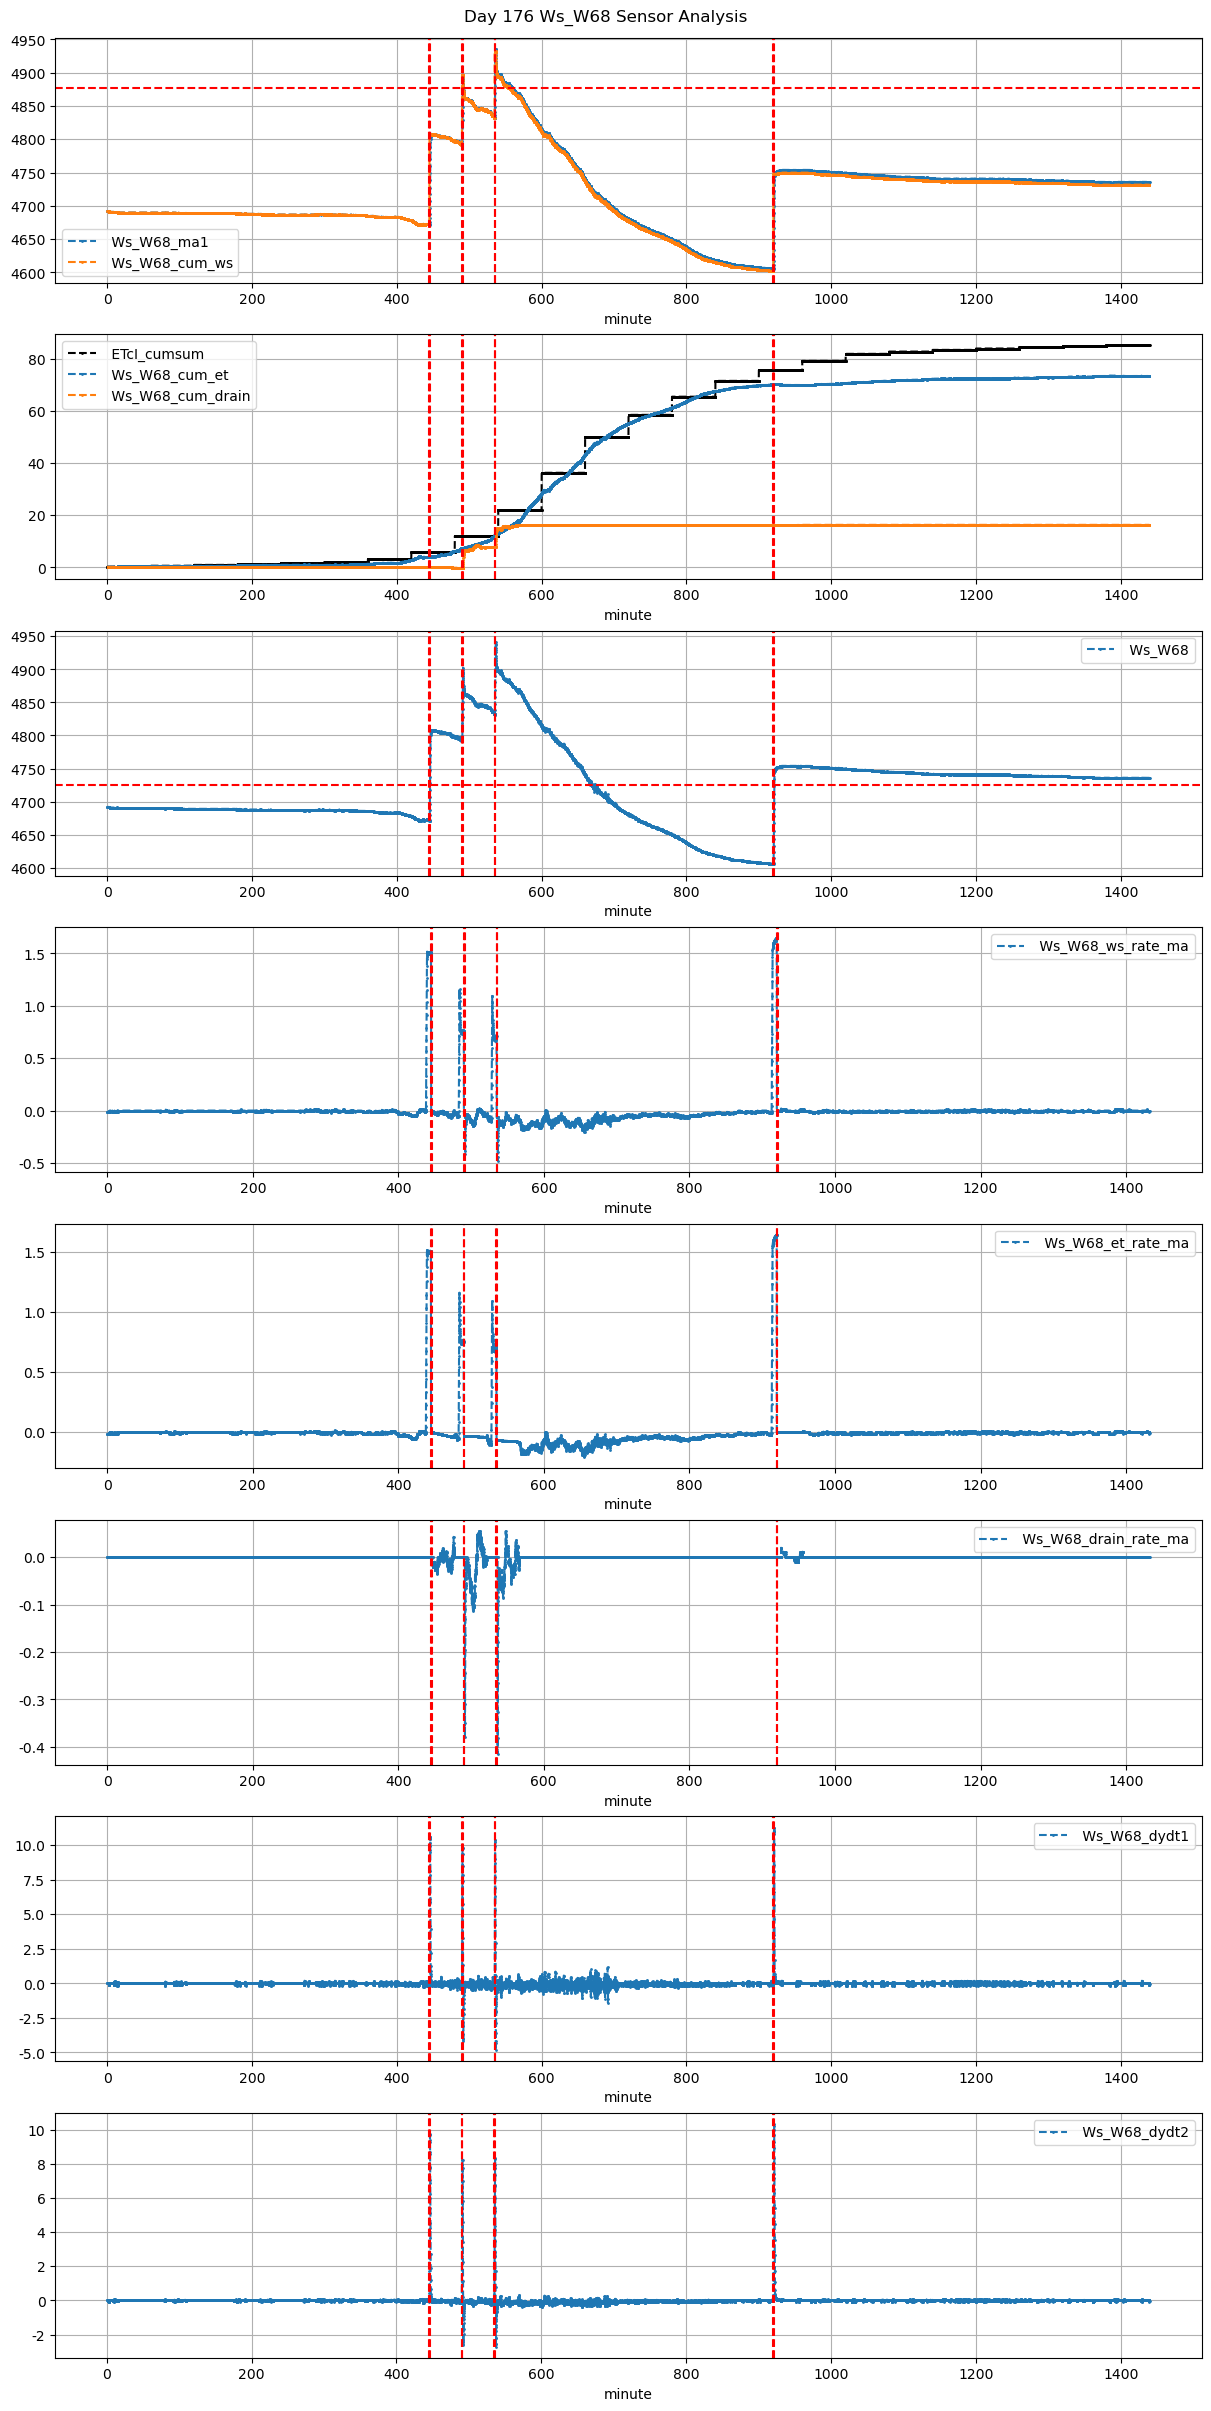
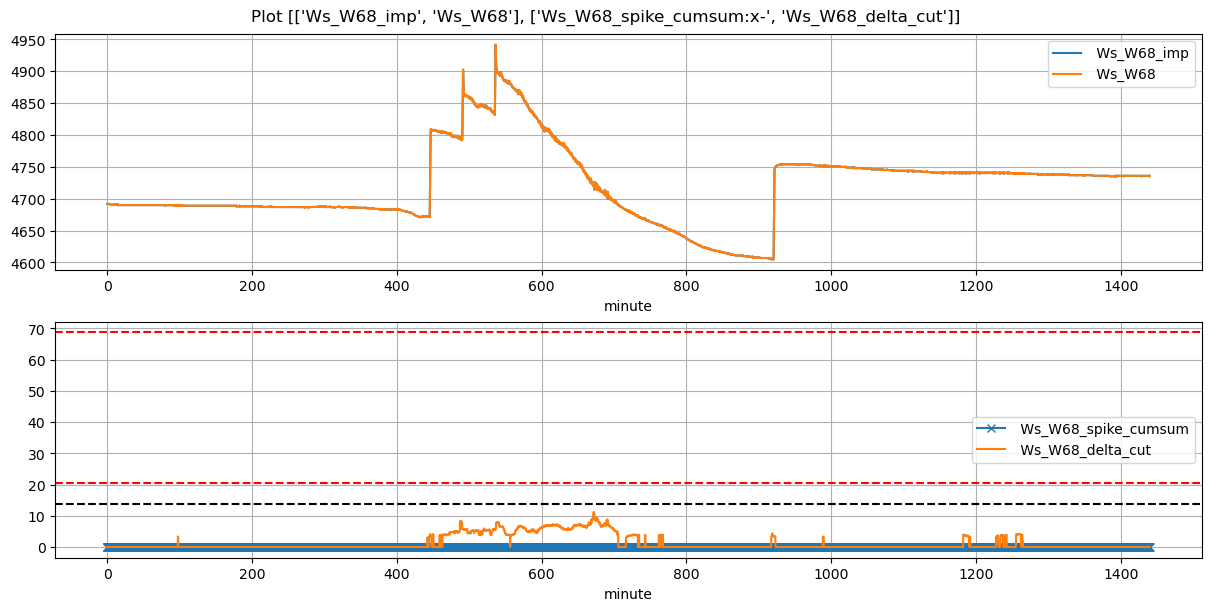
Ws_W68 |
0.455378 |
30 |
445.0 |
445.333333 |
446.0 |
447.166667 |
4672.000000 |
4808.200000 |
60 |
0.000000 |
-0.025185 |
-0.041152 |
0.344986 |
0.454000 |
27.240000 |
True |
20.0 |
70.0 |
27.900000 |
0.000000 |
0.000000 |
0.000000 |
54 |
430 |
-0.028753 |
NaN |
| 2026-03-31 08:10:00+08:00 |
176 |
490 |
Ws_W68 |
0.455378 |
30 |
490.0 |
490.250000 |
491.0 |
491.583333 |
4793.200000 |
4897.116667 |
60 |
-0.032990 |
-0.088287 |
-0.035700 |
0.306472 |
0.346389 |
20.783333 |
True |
15.0 |
35.0 |
27.900000 |
4.032718 |
8.065436 |
12.098155 |
949 |
40 |
-0.105848 |
4856.789485 |
| 2026-03-31 08:55:00+08:00 |
176 |
535 |
Ws_W68 |
0.455378 |
30 |
535.0 |
535.333333 |
536.0 |
536.500000 |
4835.471429 |
4935.666667 |
60 |
-0.065143 |
-0.144321 |
-0.077922 |
0.311819 |
0.333984 |
20.039048 |
True |
20.0 |
30.0 |
27.900000 |
3.938812 |
7.877623 |
11.816435 |
615 |
35 |
-0.076169 |
4896.278550 |
| 2026-03-31 15:20:00+08:00 |
176 |
920 |
Ws_W68 |
0.455378 |
30 |
920.0 |
920.250000 |
921.0 |
925.916667 |
4605.500000 |
4752.222222 |
60 |
-0.012360 |
0.000000 |
0.000000 |
0.198167 |
0.489074 |
29.344444 |
True |
15.0 |
295.0 |
29.344444 |
0.000000 |
0.000000 |
0.000000 |
114 |
1625 |
-0.011111 |
NaN |