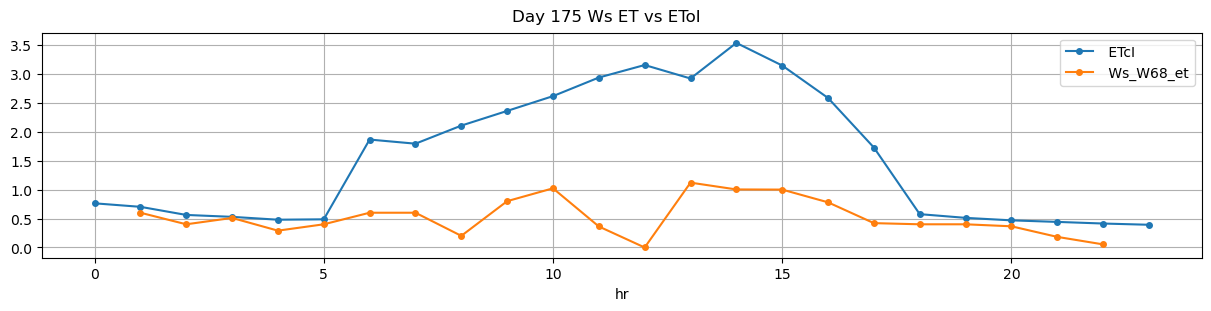
| 2026-03-30 11:15:00+08:00 |
175 |
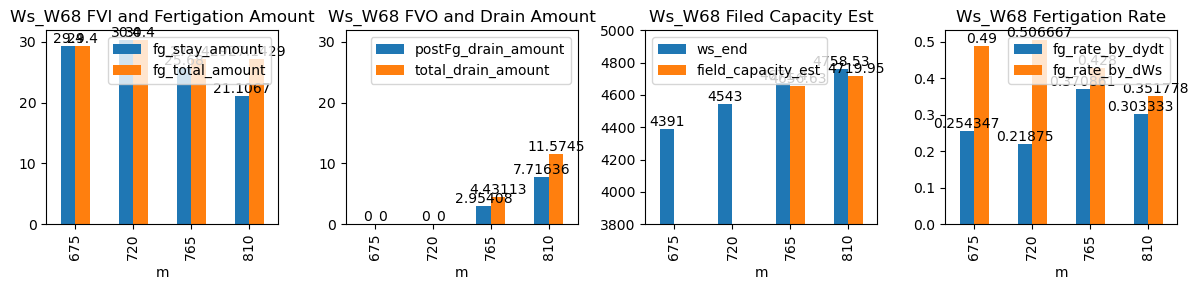
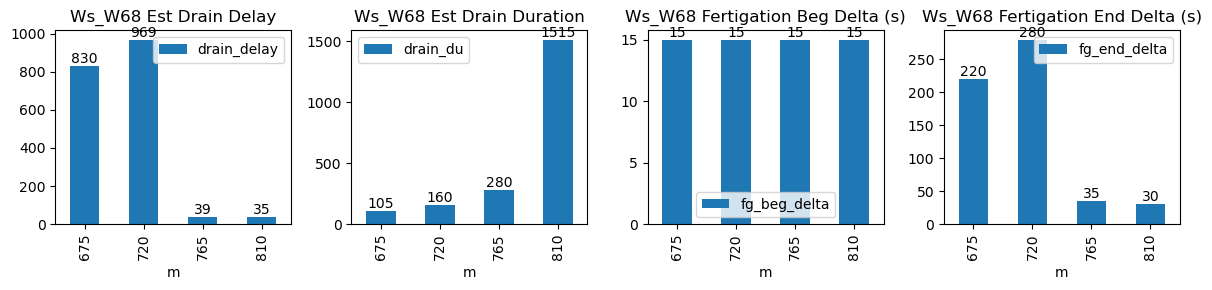
675 |
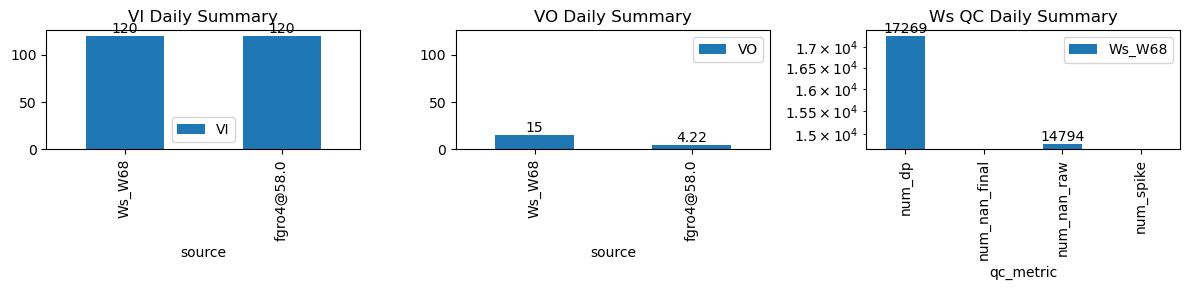
Ws_W68 |
0.262499 |
30 |
675.0 |
675.25 |
676.0 |
679.500000 |
4244.0 |
4391.0 |
60 |
-0.014901 |
0.000000 |
-0.002639 |
0.265083 |
0.490000 |
29.4 |
True |
15.0 |
210.0 |
30.0 |
0.000000 |
0.000000 |
0.000000 |
NaN |
1779 |
-0.163313 |
NaN |
| 2026-03-30 12:00:00+08:00 |
175 |
720 |
Ws_W68 |
0.262499 |
30 |
720.0 |
720.25 |
721.0 |
724.916667 |
4391.0 |
4543.0 |
60 |
0.000000 |
0.000000 |
-0.006382 |
0.251083 |
0.506667 |
30.4 |
True |
15.0 |
235.0 |
30.4 |
0.000000 |
0.000000 |
0.000000 |
4.0 |
245 |
-0.149640 |
NaN |
| 2026-03-30 12:45:00+08:00 |
175 |
765 |
Ws_W68 |
0.262499 |
30 |
765.0 |
765.25 |
766.0 |
766.500000 |
4543.0 |
4675.0 |
60 |
0.000000 |
-0.066319 |
-0.005625 |
0.376806 |
0.440000 |
26.4 |
True |
15.0 |
30.0 |
30.0 |
0.000000 |
2.914203 |
2.914203 |
95.0 |
39 |
-0.779886 |
NaN |
| 2026-03-30 13:30:00+08:00 |
175 |
810 |
Ws_W68 |
0.262499 |
30 |
810.0 |
810.25 |
811.0 |
811.500000 |
4653.0 |
4763.5 |
60 |
-0.015607 |
-0.084812 |
0.000000 |
0.303333 |
0.368333 |
22.1 |
True |
15.0 |
30.0 |
30.0 |
3.909027 |
7.818054 |
11.727081 |
139.0 |
35 |
-1.264801 |
4724.409729 |