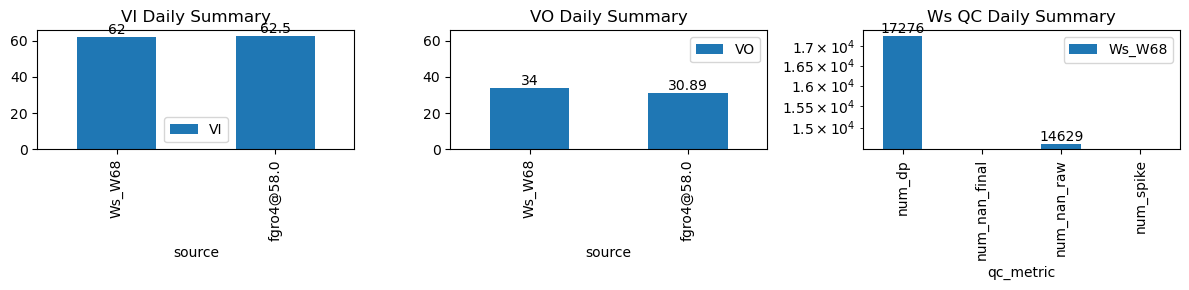
VI and VO Daily Summary
| ws_name | num_dp | num_nan_raw | num_nan_final | num_spike | cum_step_adj |
|---|---|---|---|---|---|
| Ws_W68 | 17,276 | 14,629 | 0 | 0 | 0.00 |
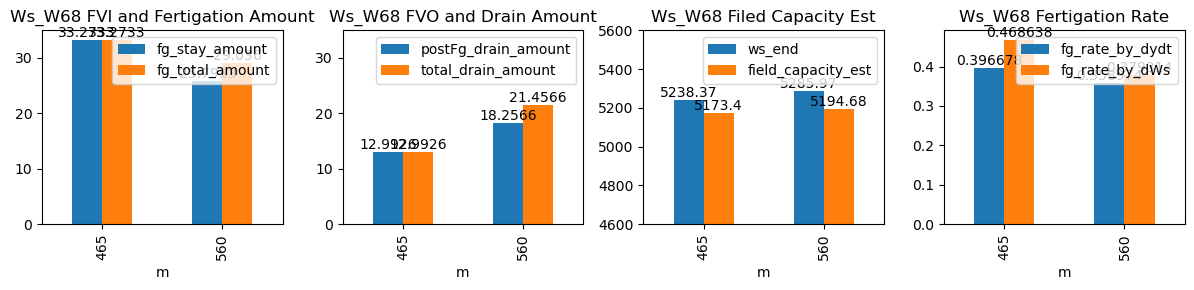
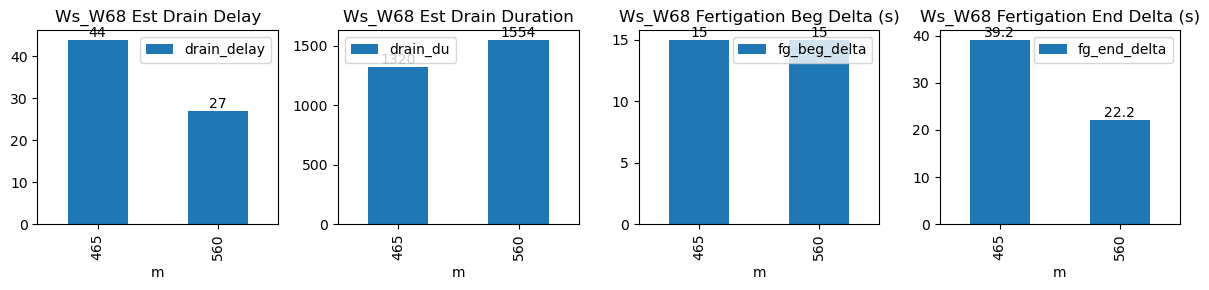
| ds | d | m | ws_name | prominence_cut | max_drain_du | fg_beg | fg_beg_est | fg_end | fg_end_est | ws_beg | ws_end | duc | pre_fg_et | post_fg_ws | post_drn_et | fg_rate_by_dydt | fg_rate_by_dWs | fg_stay_amount | enough_data | fg_beg_delta | fg_end_delta | fg_total_amount | fg_drain_amount | postFg_drain_amount | total_drain_amount | drain_du | drain_delay | drain_rate | field_capacity_est |
|---|---|---|---|---|---|---|---|---|---|---|---|---|---|---|---|---|---|---|---|---|---|---|---|---|---|---|---|---|---|
| 2026-03-18 07:45:00+08:00 | 163 | 465 | Ws_W68 | 0.630328 | 30 | 465.0 | 465.25 | 466.18 | 466.750000 | 5072.0 | 5243.0 | 71 | -0.002588 | -0.285336 | -0.027014 | 0.402266 | 0.481690 | 34.2 | True | 15.0 | 34.2 | 34.20 | 0.0 | 13.333721 | 13.333721 | 319 | 44 | -1.676616 | 5176.331397 |
| 2026-03-18 09:20:00+08:00 | 163 | 560 | Ws_W68 | 0.630328 | 30 | 560.0 | 560.25 | 561.13 | 561.583333 | 5157.0 | 5289.0 | 68 | -0.008898 | -0.338542 | -0.022778 | 0.358308 | 0.388235 | 26.4 | True | 15.0 | 27.2 | 28.56 | 2.2 | 17.984141 | 20.184141 | 360 | 32 | -2.075616 | 5199.079294 |