| 2026-03-06 08:00:00+08:00 |
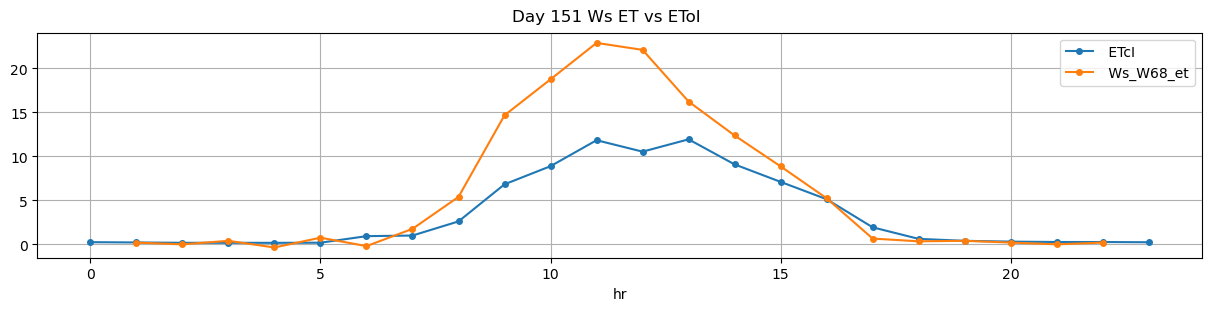
151 |
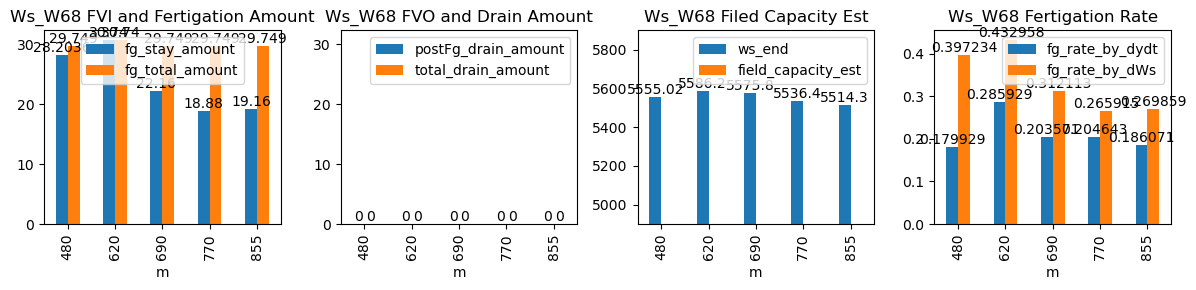
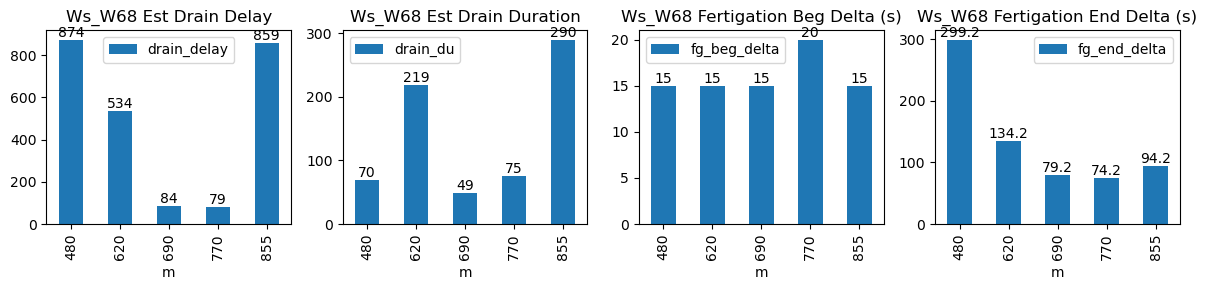
480 |
Ws_W68 |
0.381826 |
30 |
480.0 |
480.250000 |
481.18 |
486.166667 |
5414.0 |
5555.018182 |
71 |
-0.024594 |
-0.012963 |
-0.037078 |
0.179929 |
0.397234 |
28.203636 |
True |
15.0 |
299.2 |
29.749 |
0.0 |
0 |
0.0 |
70 |
874 |
-0.018115 |
NaN |
| 2026-03-06 10:20:00+08:00 |
151 |
620 |
Ws_W68 |
0.381826 |
30 |
620.0 |
620.250000 |
621.18 |
623.416667 |
5432.5 |
5586.200000 |
71 |
-0.112984 |
-0.157284 |
-0.172150 |
0.285929 |
0.432958 |
30.740000 |
True |
15.0 |
134.2 |
30.740 |
0.0 |
0 |
0.0 |
219 |
534 |
-0.109826 |
NaN |
| 2026-03-06 11:30:00+08:00 |
151 |
690 |
Ws_W68 |
0.381826 |
30 |
690.0 |
690.250000 |
691.18 |
692.500000 |
5465.0 |
5575.800000 |
71 |
-0.180587 |
-0.106085 |
-0.132459 |
0.203571 |
0.312113 |
22.160000 |
True |
15.0 |
79.2 |
29.749 |
0.0 |
0 |
0.0 |
49 |
84 |
-0.057942 |
NaN |
| 2026-03-06 12:50:00+08:00 |
151 |
770 |
Ws_W68 |
0.381826 |
30 |
770.0 |
770.333333 |
771.18 |
772.416667 |
5442.0 |
5536.400000 |
71 |
-0.176717 |
-0.111481 |
-0.140453 |
0.204643 |
0.265915 |
18.880000 |
True |
20.0 |
74.2 |
29.749 |
0.0 |
0 |
0.0 |
75 |
79 |
-0.065780 |
NaN |
| 2026-03-06 14:15:00+08:00 |
151 |
855 |
Ws_W68 |
0.381826 |
30 |
855.0 |
855.250000 |
856.18 |
857.750000 |
5418.5 |
5514.300000 |
71 |
-0.099610 |
-0.071790 |
-0.064012 |
0.186071 |
0.269859 |
19.160000 |
True |
15.0 |
94.2 |
29.749 |
0.0 |
0 |
0.0 |
290 |
859 |
-0.045115 |
NaN |