VI and VO Daily Summary
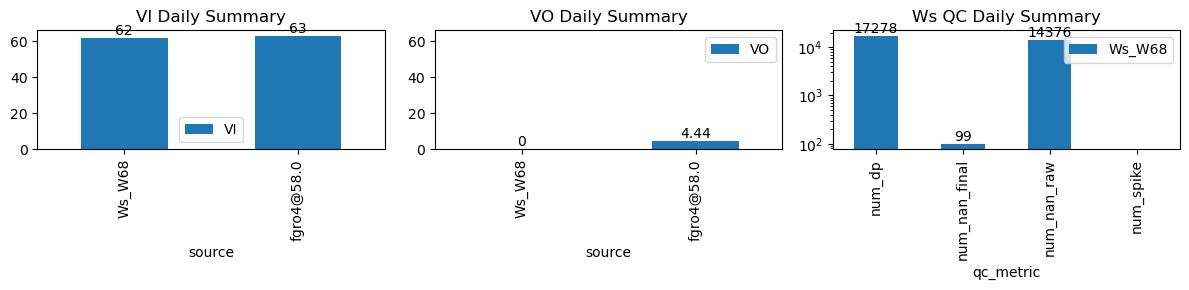
| ws_name | num_dp | num_nan_raw | num_nan_final | num_spike | cum_step_adj |
|---|---|---|---|---|---|
| Ws_W68 | 17,278 | 14,376 | 99 | 0 | 0.00 |
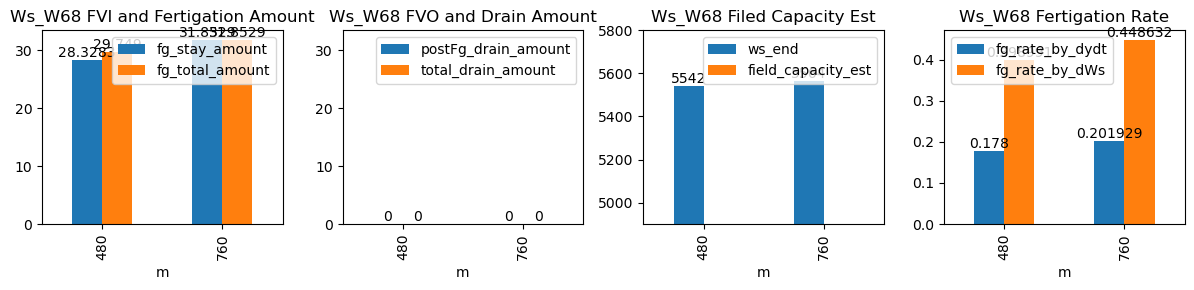
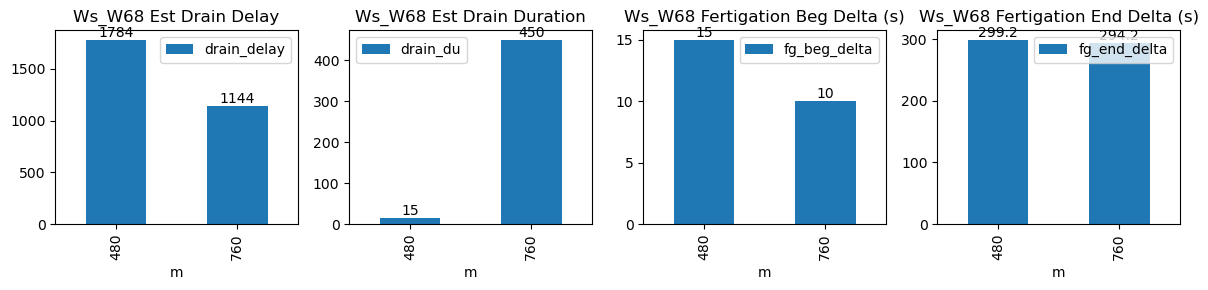
| ds | d | m | ws_name | prominence_cut | max_drain_du | fg_beg | fg_beg_est | fg_end | fg_end_est | ws_beg | ws_end | duc | pre_fg_et | post_fg_ws | post_drn_et | fg_rate_by_dydt | fg_rate_by_dWs | fg_stay_amount | enough_data | fg_beg_delta | fg_end_delta | fg_total_amount | fg_drain_amount | postFg_drain_amount | total_drain_amount | drain_du | drain_delay | drain_rate | field_capacity_est |
|---|---|---|---|---|---|---|---|---|---|---|---|---|---|---|---|---|---|---|---|---|---|---|---|---|---|---|---|---|---|
| 2026-03-05 08:00:00+08:00 | 150 | 480 | Ws_W68 | 0.1761 | 30 | 480.0 | 480.250000 | 481.18 | 486.166667 | 5400.358333 | 5542.0 | 71 | -0.002285 | 0.000000 | -0.006533 | 0.178000 | 0.398991 | 28.328333 | True | 15.0 | 299.2 | 29.749000 | 0.0 | 0 | 0.0 | 15 | 1784 | -0.005715 | NaN |
| 2026-03-05 12:40:00+08:00 | 150 | 760 | Ws_W68 | 0.1761 | 30 | 760.0 | 760.166667 | 761.18 | 766.083333 | 5404.735714 | 5564.0 | 71 | -0.079872 | -0.031235 | -0.097296 | 0.201929 | 0.448632 | 31.852857 | True | 10.0 | 294.2 | 31.852857 | 0.0 | 0 | 0.0 | 450 | 1144 | -0.023442 | NaN |