| 2026-03-04 08:00:00+08:00 |
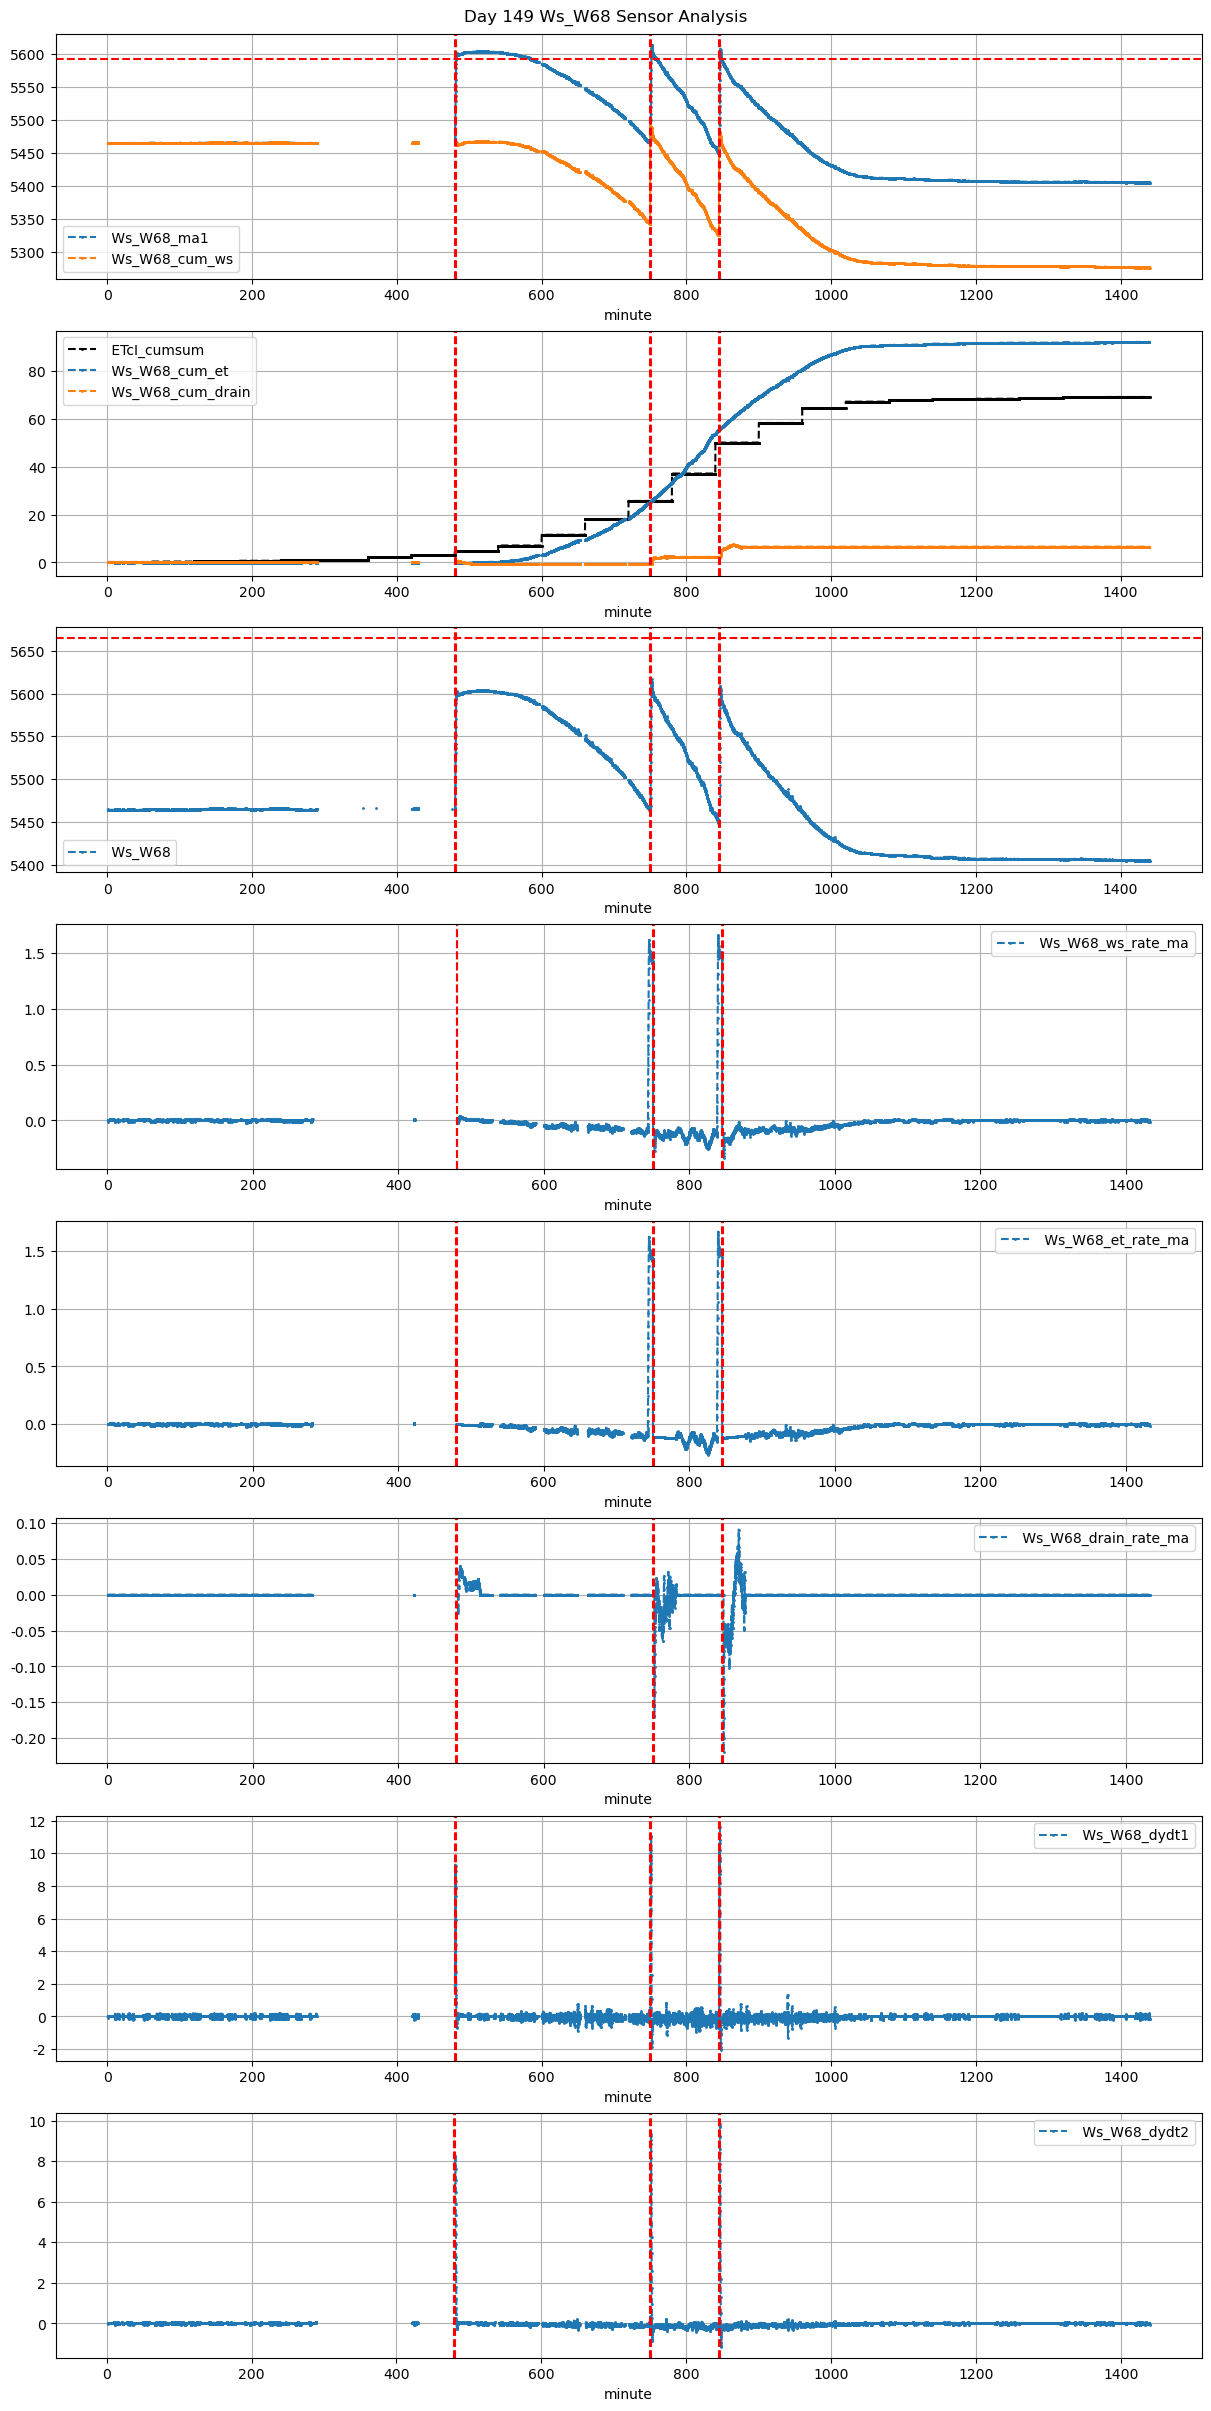
149 |
480 |
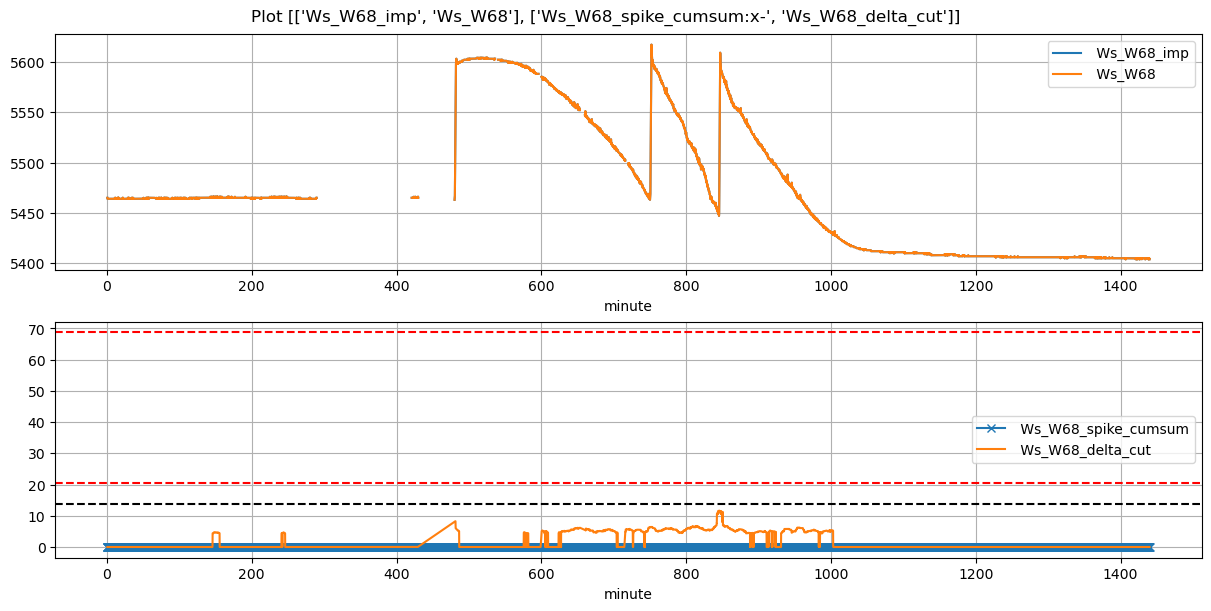
Ws_W68 |
0.327965 |
30 |
480.0 |
NaN |
481.18 |
482.500000 |
5465.0 |
5603.0 |
71 |
NaN |
0.000000 |
NaN |
NaN |
0.388732 |
27.6 |
False |
NaN |
79.2 |
NaN |
0.0 |
NaN |
NaN |
NaN |
NaN |
NaN |
NaN |
| 2026-03-04 12:30:00+08:00 |
149 |
750 |
Ws_W68 |
0.327965 |
30 |
750.0 |
750.25 |
751.18 |
752.000000 |
5465.0 |
5617.0 |
71 |
-0.096247 |
-0.142168 |
-0.130764 |
0.337143 |
0.428169 |
30.4 |
True |
15.0 |
49.2 |
30.4 |
0.0 |
3.340589 |
3.340589 |
150.0 |
59.0 |
-0.550811 |
NaN |
| 2026-03-04 14:05:00+08:00 |
149 |
845 |
Ws_W68 |
0.327965 |
30 |
845.0 |
845.25 |
846.18 |
846.916667 |
5451.0 |
5609.0 |
71 |
-0.109793 |
-0.199875 |
-0.107072 |
0.368214 |
0.445070 |
31.6 |
True |
15.0 |
44.2 |
31.6 |
0.0 |
4.182857 |
4.182857 |
150.0 |
54.0 |
-0.691296 |
NaN |