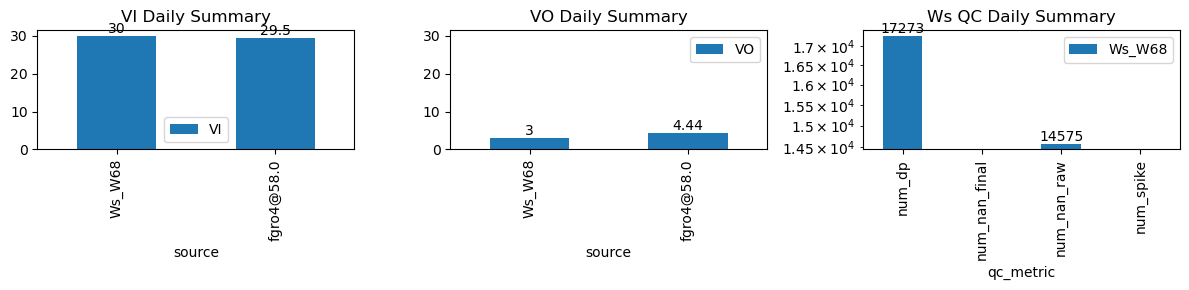
VI and VO Daily Summary
| ws_name | num_dp | num_nan_raw | num_nan_final | num_spike | cum_step_adj |
|---|---|---|---|---|---|
| Ws_W68 | 17,273 | 14,575 | 0 | 0 | 0.00 |
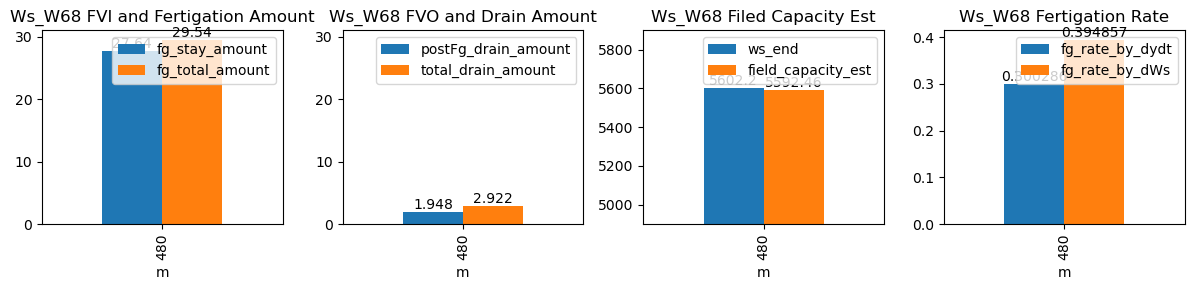
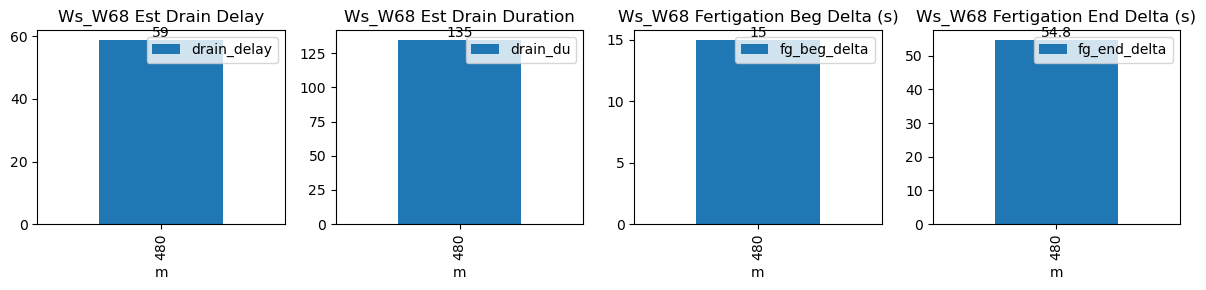
| ds | d | m | ws_name | prominence_cut | max_drain_du | fg_beg | fg_beg_est | fg_end | fg_end_est | ws_beg | ws_end | duc | pre_fg_et | post_fg_ws | post_drn_et | fg_rate_by_dydt | fg_rate_by_dWs | fg_stay_amount | enough_data | fg_beg_delta | fg_end_delta | fg_total_amount | fg_drain_amount | postFg_drain_amount | total_drain_amount | drain_du | drain_delay | drain_rate | field_capacity_est |
|---|---|---|---|---|---|---|---|---|---|---|---|---|---|---|---|---|---|---|---|---|---|---|---|---|---|---|---|---|---|
| 2026-03-03 08:00:00+08:00 | 148 | 480 | Ws_W68 | 0.125024 | 30 | 480.0 | 480.25 | 481.17 | 482.083333 | 5464.0 | 5602.2 | 70 | 0.0 | -0.008025 | 0.0 | 0.300286 | 0.394857 | 27.64 | True | 15.0 | 54.8 | 29.54 | 0.974 | 1.948 | 2.922 | 135 | 59 | -0.095556 | 5592.46 |