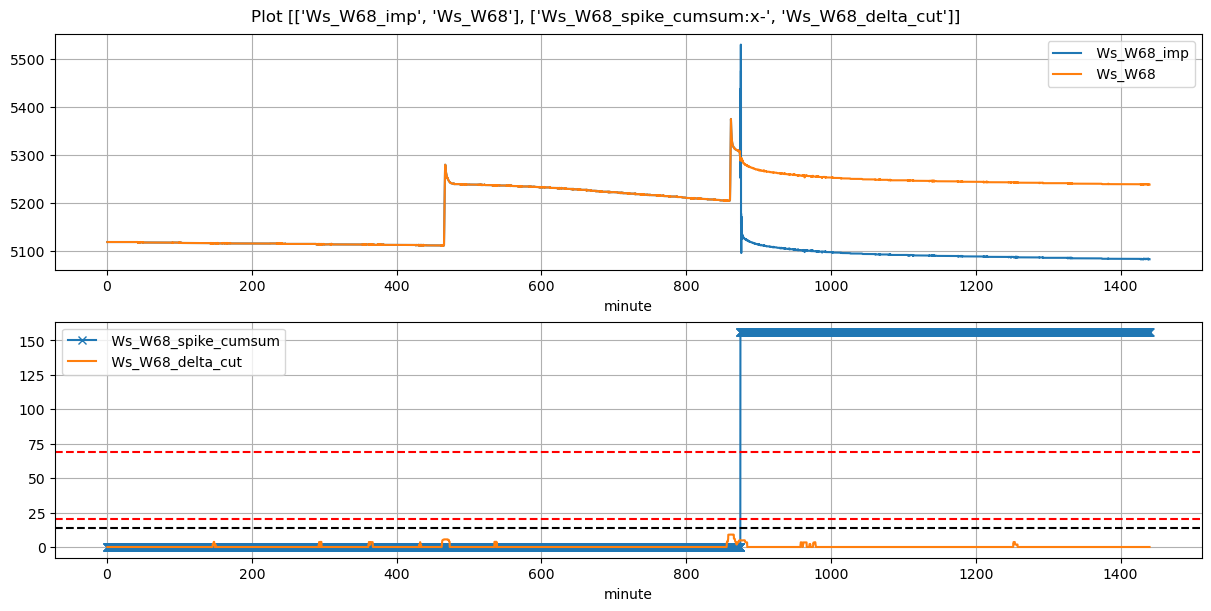
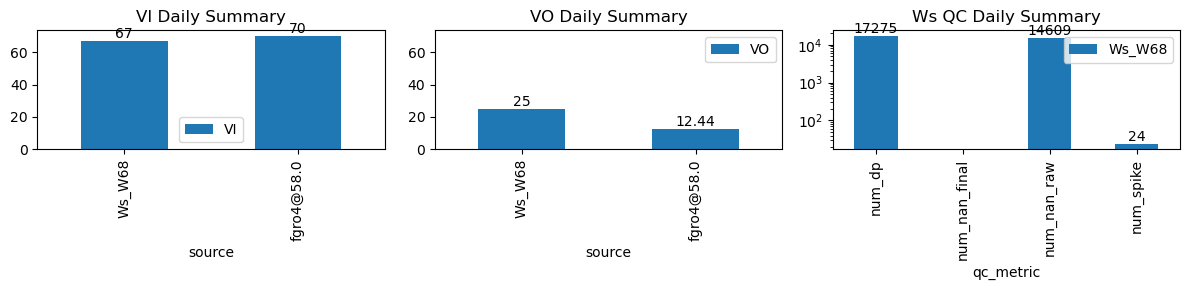
VI and VO Daily Summary
| ws_name | num_dp | num_nan_raw | num_nan_final | num_spike | cum_step_adj |
|---|---|---|---|---|---|
| Ws_W68 | 17,275 | 14,609 | 0 | 24 | 155.90 |
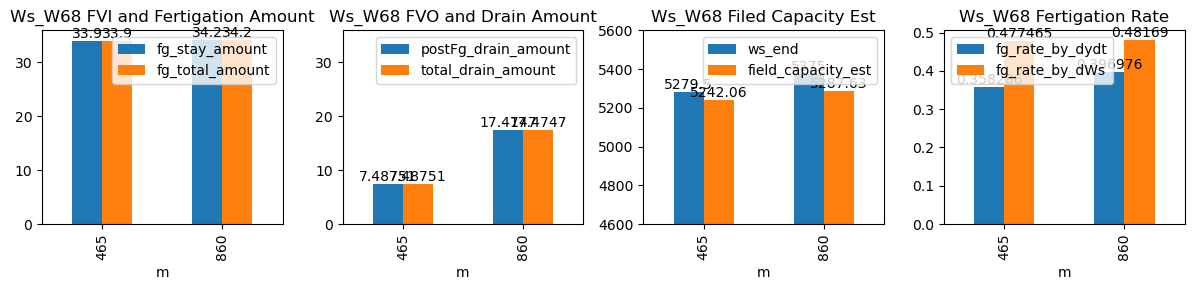
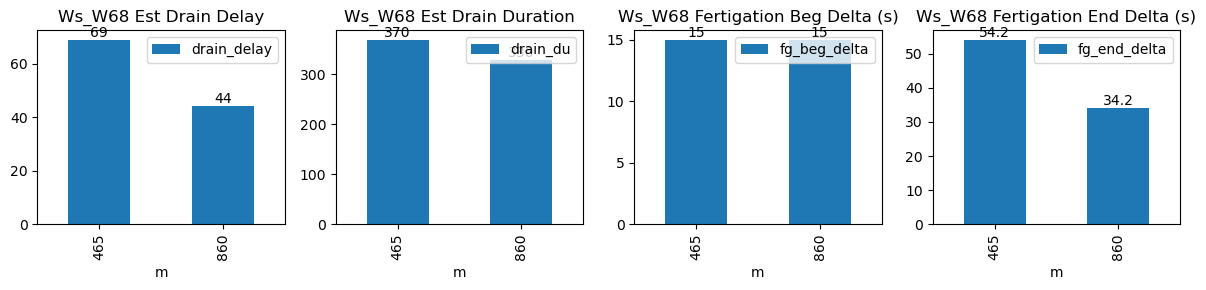
| ds | d | m | ws_name | prominence_cut | max_drain_du | fg_beg | fg_beg_est | fg_end | fg_end_est | ws_beg | ws_end | duc | pre_fg_et | post_fg_ws | post_drn_et | fg_rate_by_dydt | fg_rate_by_dWs | fg_stay_amount | enough_data | fg_beg_delta | fg_end_delta | fg_total_amount | fg_drain_amount | postFg_drain_amount | total_drain_amount | drain_du | drain_delay | drain_rate | field_capacity_est |
|---|---|---|---|---|---|---|---|---|---|---|---|---|---|---|---|---|---|---|---|---|---|---|---|---|---|---|---|---|---|
| 2026-03-17 07:45:00+08:00 | 162 | 465 | Ws_W68 | 0.414388 | 30 | 465.0 | 465.25 | 466.18 | 467.083333 | 5110.0 | 5279.5 | 71 | -0.010064 | -0.257789 | -0.003306 | 0.358286 | 0.477465 | 33.9 | True | 15.0 | 54.2 | 33.9 | 0.0 | 7.487505 | 7.487505 | 370 | 69 | -0.896388 | 5242.062474 |
| 2026-03-17 14:20:00+08:00 | 162 | 860 | Ws_W68 | 0.414388 | 30 | 860.0 | 860.25 | 861.18 | 861.750000 | 5204.0 | 5375.0 | 71 | -0.008204 | -0.279319 | -0.048409 | 0.396976 | 0.481690 | 34.2 | True | 15.0 | 34.2 | 34.2 | 0.0 | 17.474681 | 17.474681 | 330 | 44 | -1.924824 | 5287.626595 |