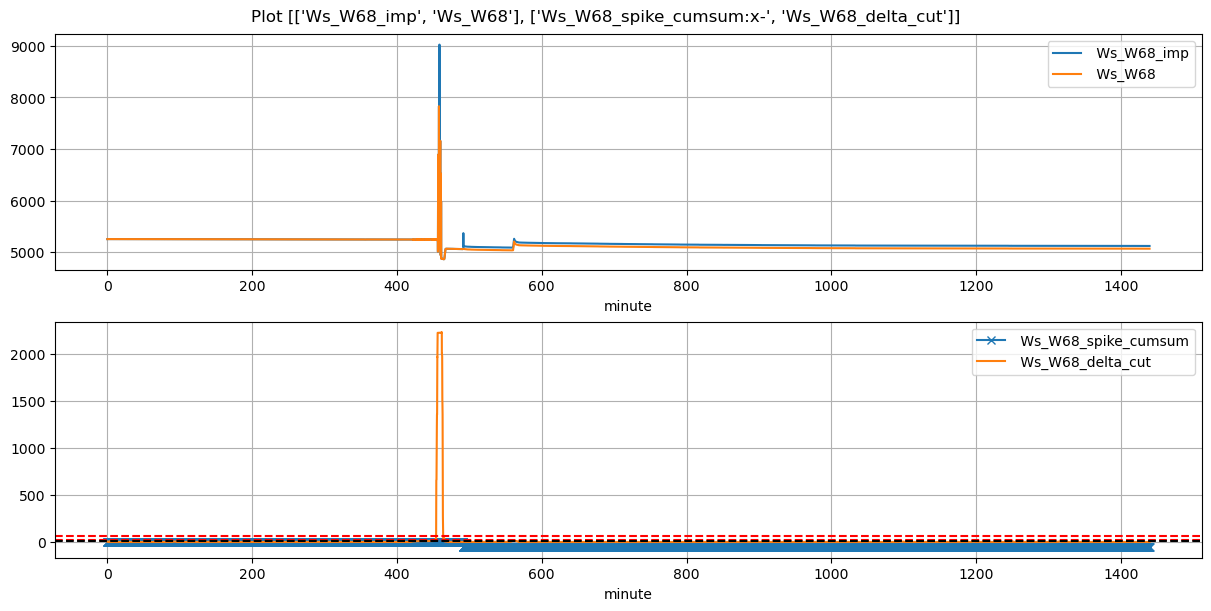
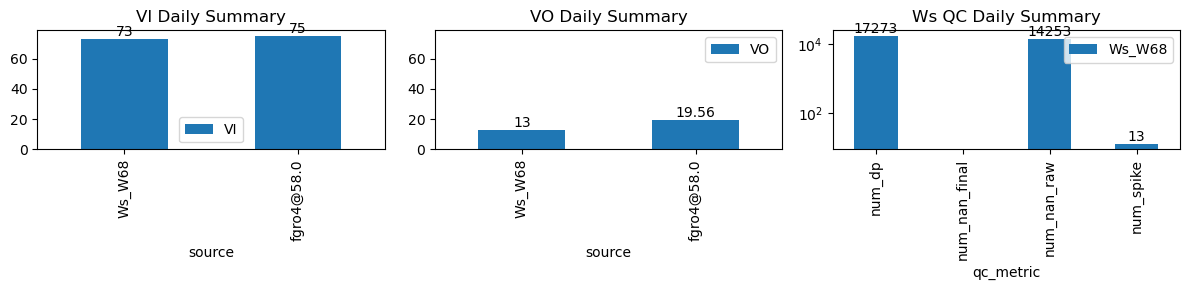
VI and VO Daily Summary
| ws_name | num_dp | num_nan_raw | num_nan_final | num_spike | cum_step_adj |
|---|---|---|---|---|---|
| Ws_W68 | 17,273 | 14,253 | 0 | 13 | -53.00 |
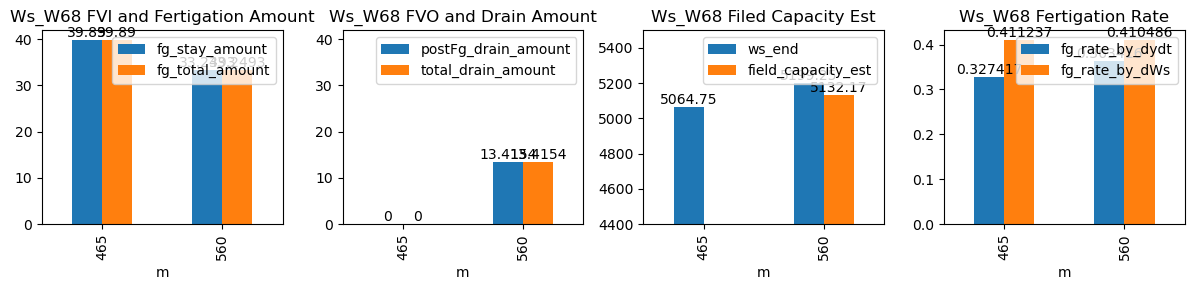
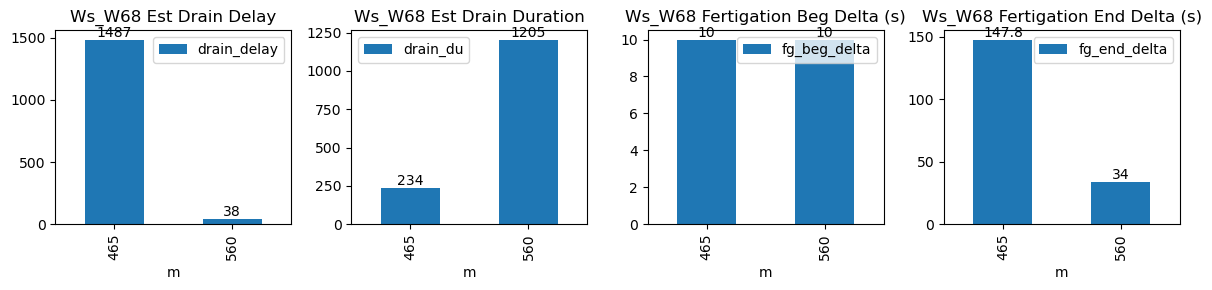
| ds | d | m | ws_name | prominence_cut | max_drain_du | fg_beg | fg_beg_est | fg_end | fg_end_est | ws_beg | ws_end | duc | pre_fg_et | post_fg_ws | post_drn_et | fg_rate_by_dydt | fg_rate_by_dWs | fg_stay_amount | enough_data | fg_beg_delta | fg_end_delta | fg_total_amount | fg_drain_amount | postFg_drain_amount | total_drain_amount | drain_du | drain_delay | drain_rate | field_capacity_est |
|---|---|---|---|---|---|---|---|---|---|---|---|---|---|---|---|---|---|---|---|---|---|---|---|---|---|---|---|---|---|
| 2026-03-16 07:45:00+08:00 | 161 | 465 | Ws_W68 | 10.777847 | 30 | 465.0 | 465.166667 | 466.62 | 469.083333 | 4865.3 | 5064.750000 | 97 | 0.000000 | -0.031852 | -0.068595 | 0.327417 | 0.411237 | 39.890000 | True | 10.0 | 147.8 | 39.890000 | 0.0 | 0.0000 | 0.0000 | 234 | 1487 | -0.051289 | NaN |
| 2026-03-16 09:20:00+08:00 | 161 | 560 | Ws_W68 | 10.777847 | 30 | 560.0 | 560.166667 | 561.35 | 561.916667 | 5033.0 | 5199.246667 | 81 | -0.020611 | -0.202691 | -0.019558 | 0.363416 | 0.410486 | 33.249333 | True | 10.0 | 34.0 | 33.249333 | 0.0 | 13.4154 | 13.4154 | 1205 | 38 | -0.340767 | 5132.169665 |