| 2026-04-03 08:30:00+08:00 |
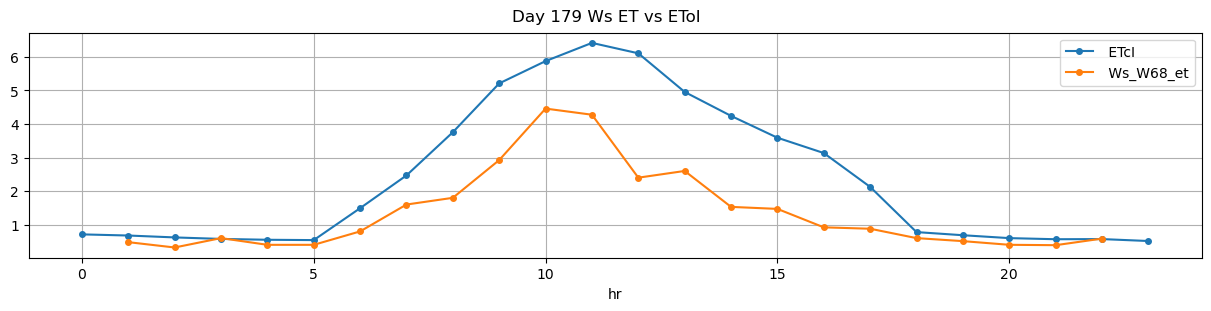
179 |
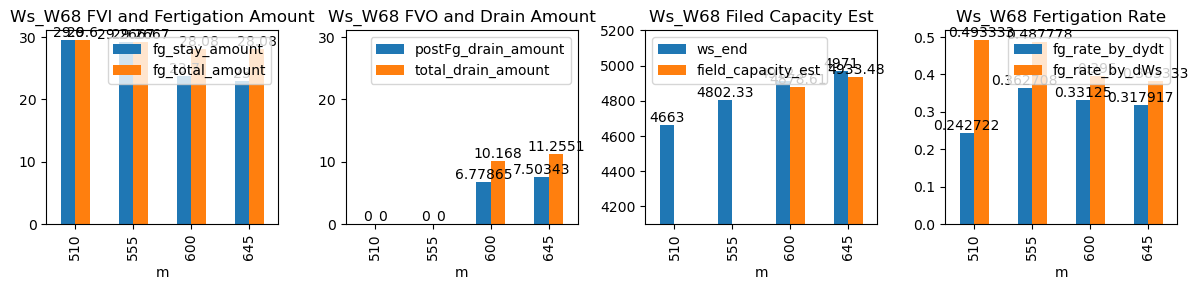
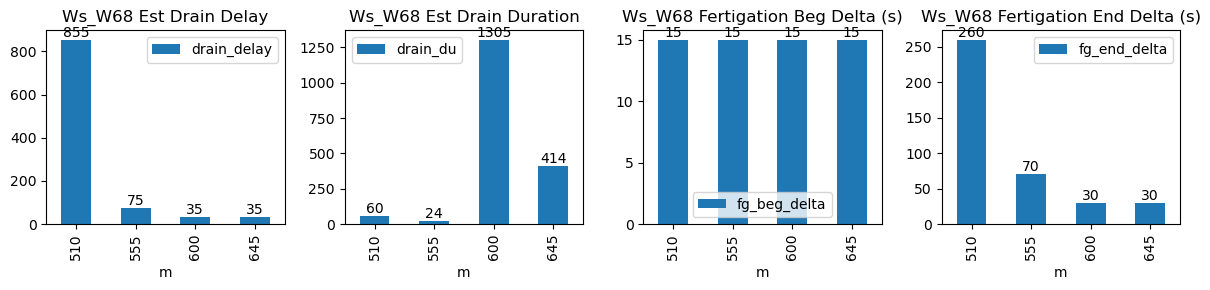
510 |
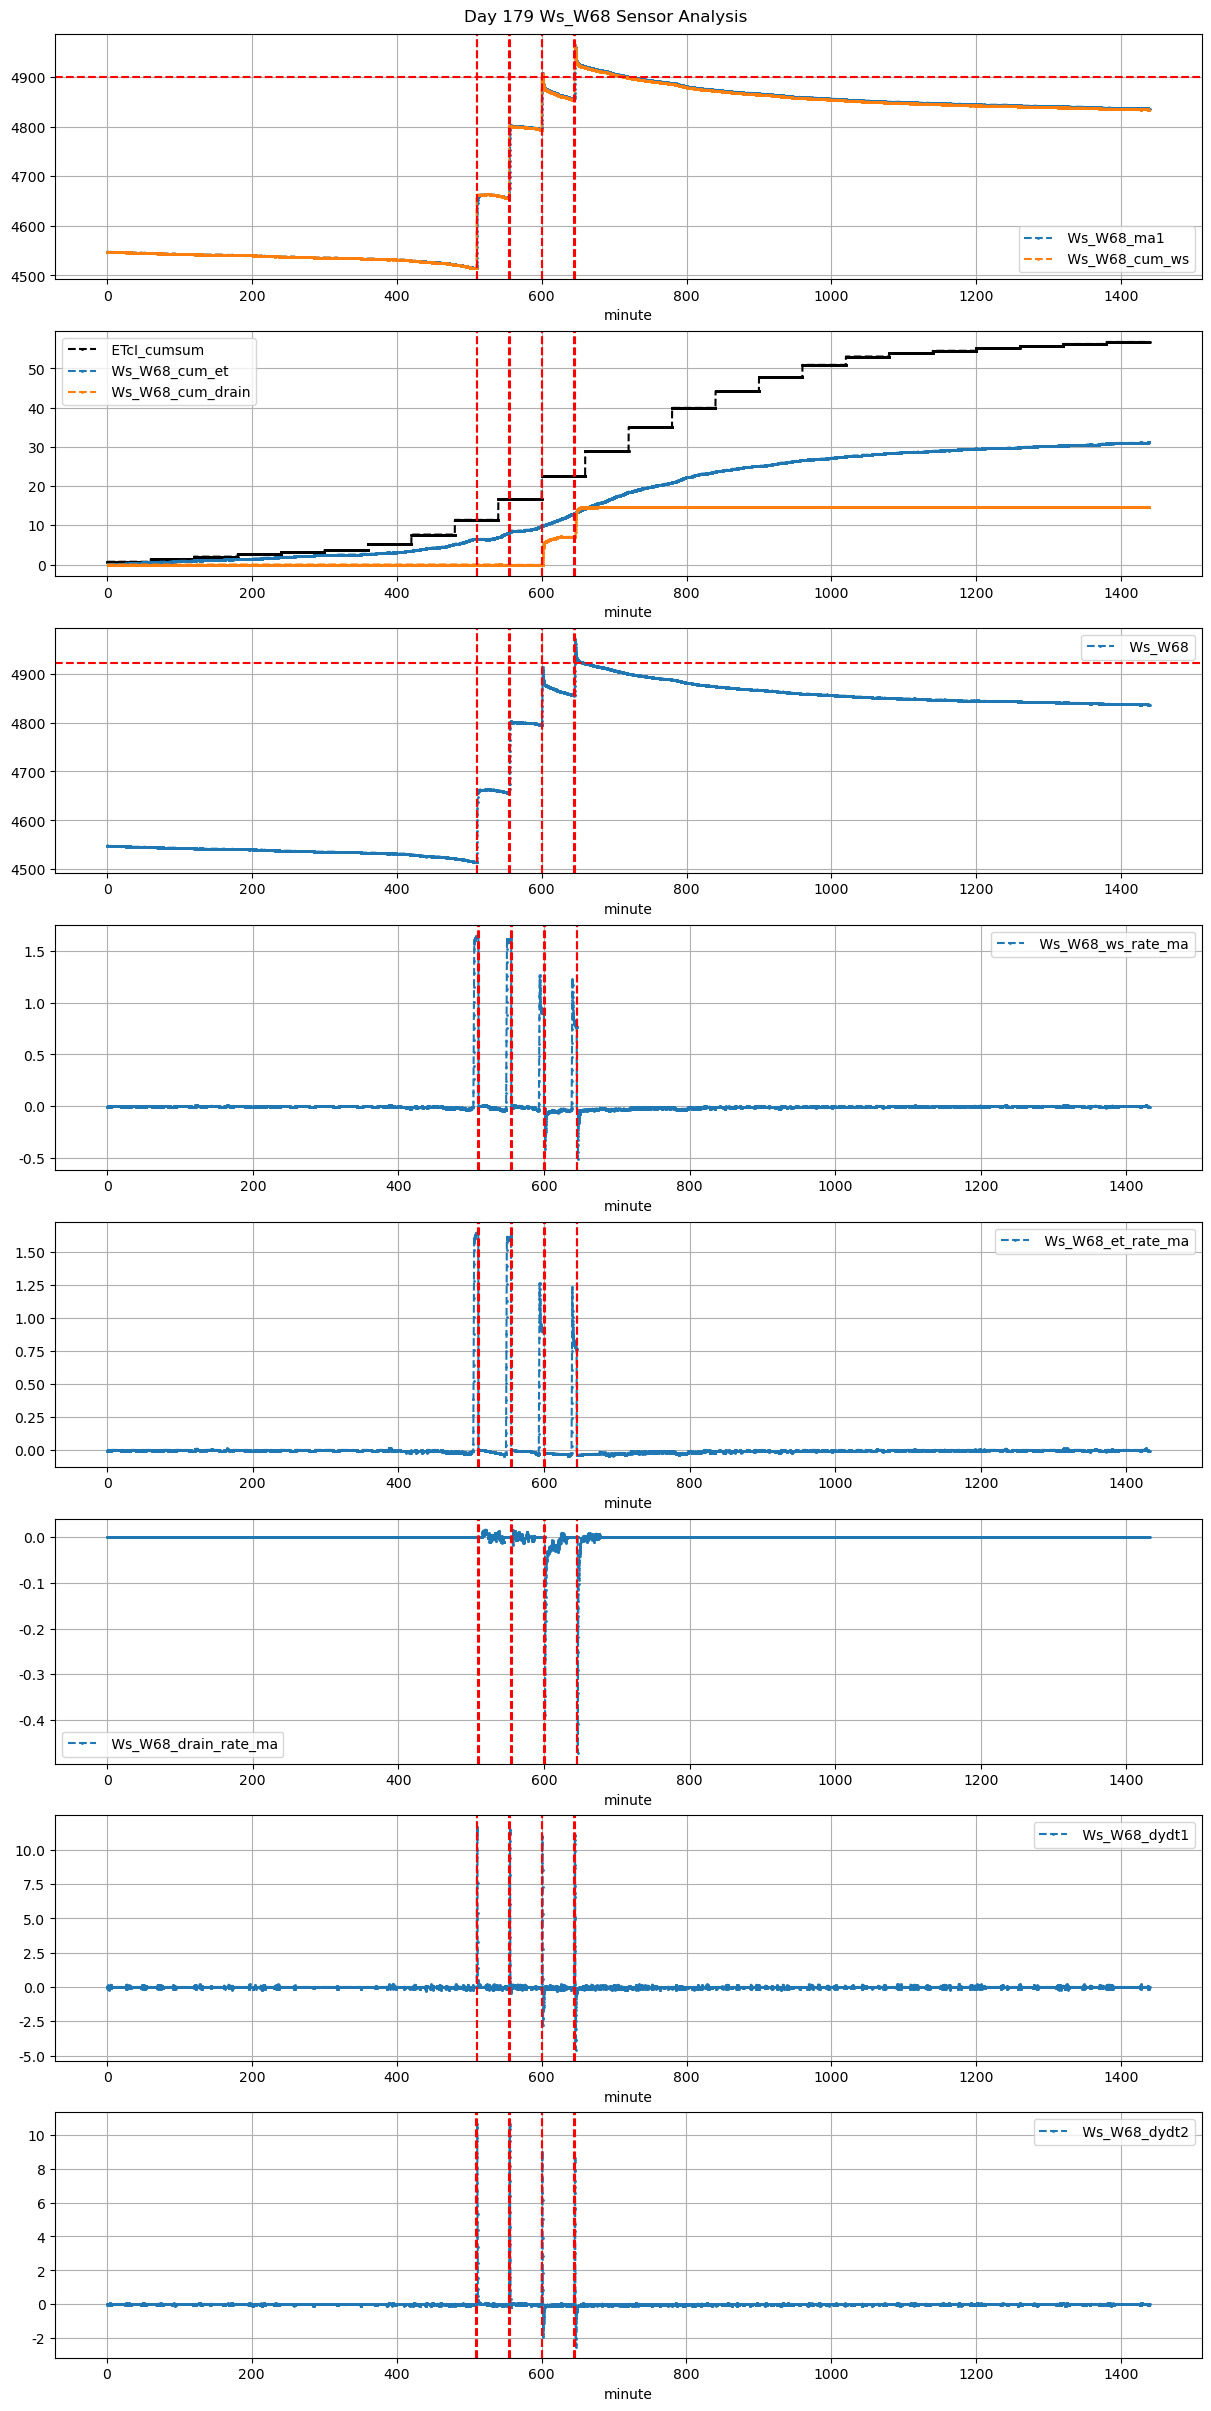
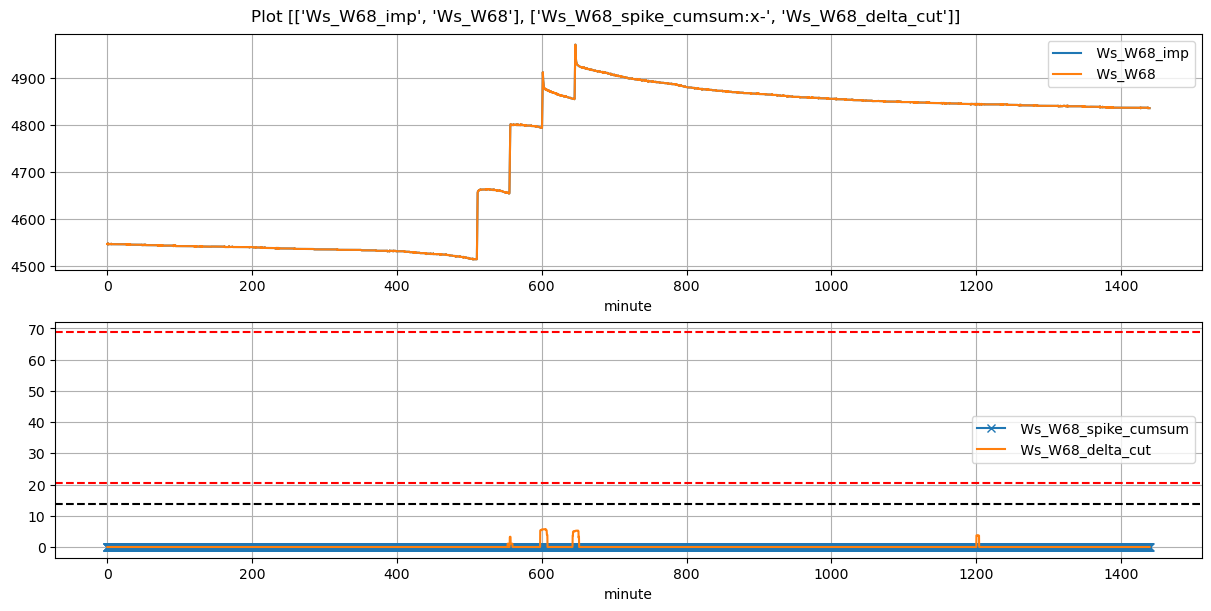
Ws_W68 |
0.553039 |
30 |
510.0 |
510.25 |
511.0 |
515.000000 |
4515.0 |
4663.000000 |
60 |
-0.015819 |
0.000000 |
-0.035764 |
0.242722 |
0.493333 |
29.600000 |
True |
15.0 |
240.0 |
29.600000 |
0.000000 |
0.000000 |
0.000000 |
24 |
1275 |
-0.179100 |
NaN |
| 2026-04-03 09:15:00+08:00 |
179 |
555 |
Ws_W68 |
0.553039 |
30 |
555.0 |
555.25 |
556.0 |
557.333333 |
4656.0 |
4802.333333 |
60 |
-0.032768 |
0.000000 |
-0.014444 |
0.362708 |
0.487778 |
29.266667 |
True |
15.0 |
80.0 |
29.266667 |
0.000000 |
0.000000 |
0.000000 |
35 |
84 |
-0.177950 |
NaN |
| 2026-04-03 10:00:00+08:00 |
179 |
600 |
Ws_W68 |
0.553039 |
30 |
600.0 |
600.25 |
601.0 |
601.500000 |
4794.0 |
4912.500000 |
60 |
-0.035299 |
-0.142766 |
-0.030681 |
0.331250 |
0.395000 |
23.700000 |
True |
15.0 |
30.0 |
28.080000 |
3.389326 |
6.778652 |
10.167979 |
190 |
39 |
-1.452336 |
4878.606738 |
| 2026-04-03 10:45:00+08:00 |
179 |
645 |
Ws_W68 |
0.553039 |
30 |
645.0 |
645.25 |
646.0 |
646.500000 |
4856.0 |
4971.000000 |
60 |
-0.036368 |
-0.158927 |
-0.028269 |
0.317917 |
0.383333 |
23.000000 |
True |
15.0 |
30.0 |
28.080000 |
3.751716 |
7.503433 |
11.255149 |
379 |
35 |
-1.176363 |
4933.482835 |