| 2026-04-09 08:25:00+08:00 |
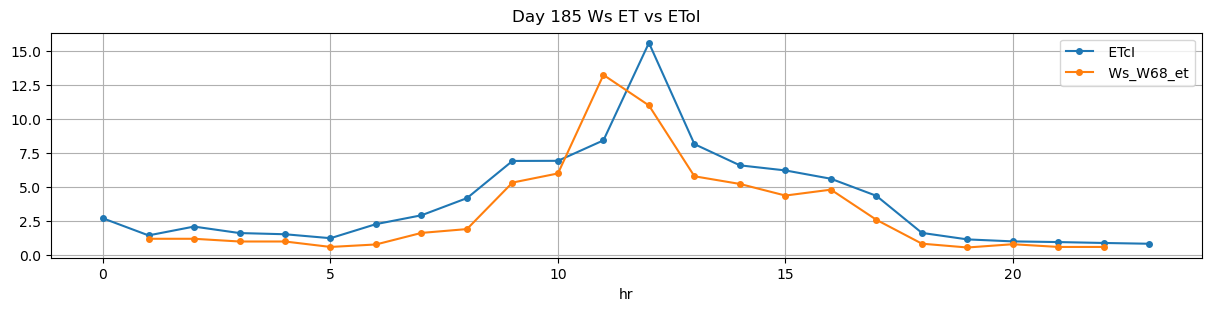
185 |
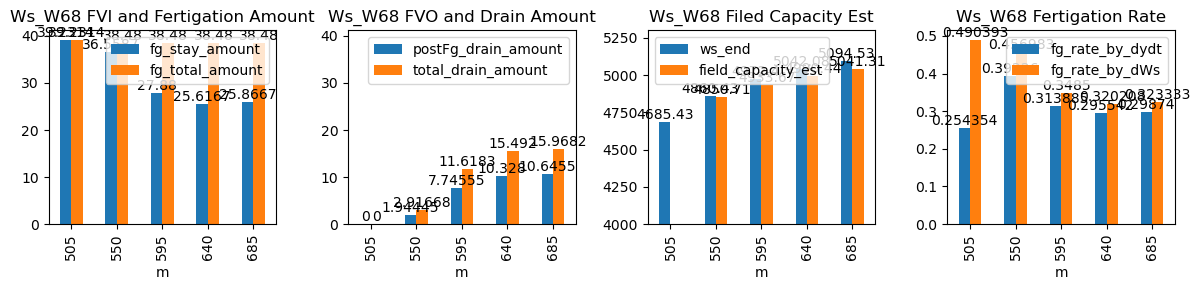
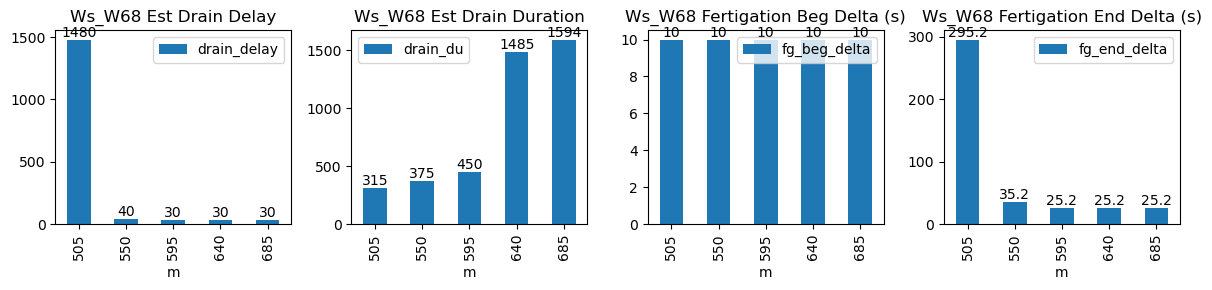
505 |
Ws_W68 |
0.632569 |
30 |
505.0 |
505.166667 |
506.33 |
511.250000 |
4489.00 |
4685.428571 |
80 |
-0.012288 |
-0.006066 |
-0.034977 |
0.254354 |
0.491071 |
39.285714 |
True |
10.0 |
295.2 |
39.285714 |
0.000000 |
0.000000 |
0.000000 |
10 |
325 |
-0.178324 |
NaN |
| 2026-04-09 09:10:00+08:00 |
185 |
550 |
Ws_W68 |
0.632569 |
30 |
550.0 |
550.166667 |
551.33 |
551.833333 |
4677.12 |
4865.000000 |
80 |
-0.033904 |
-0.061019 |
-0.059569 |
0.394896 |
0.469700 |
37.576000 |
True |
10.0 |
30.2 |
38.480000 |
0.000000 |
0.949659 |
0.949659 |
60 |
40 |
-1.507519 |
NaN |
| 2026-04-09 09:55:00+08:00 |
185 |
595 |
Ws_W68 |
0.632569 |
30 |
595.0 |
595.166667 |
596.33 |
596.833333 |
4833.00 |
4980.000000 |
80 |
-0.027248 |
-0.154259 |
-0.052579 |
0.311354 |
0.367500 |
29.400000 |
True |
10.0 |
30.2 |
38.480000 |
3.800616 |
7.601231 |
11.401847 |
225 |
40 |
-2.686294 |
4941.993843 |
| 2026-04-09 10:40:00+08:00 |
185 |
640 |
Ws_W68 |
0.632569 |
30 |
640.0 |
640.166667 |
641.33 |
641.833333 |
4913.50 |
5046.666667 |
80 |
-0.032274 |
-0.180469 |
-0.052894 |
0.293229 |
0.332917 |
26.633333 |
True |
10.0 |
30.2 |
38.480000 |
5.188195 |
10.376390 |
15.564585 |
219 |
40 |
-3.767574 |
4994.784715 |
| 2026-04-09 11:25:00+08:00 |
185 |
685 |
Ws_W68 |
0.632569 |
30 |
685.0 |
685.166667 |
686.33 |
686.750000 |
4965.00 |
5098.333333 |
80 |
-0.049491 |
-0.265972 |
-0.191875 |
0.298740 |
0.333333 |
26.666667 |
True |
10.0 |
25.2 |
38.480000 |
5.397562 |
10.795125 |
16.192687 |
204 |
40 |
-4.088811 |
5044.357711 |