| 2026-04-12 09:35:00+08:00 |
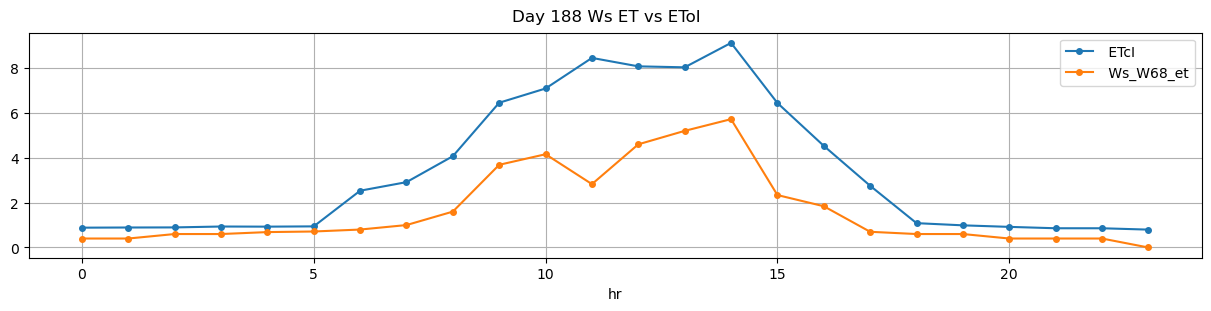
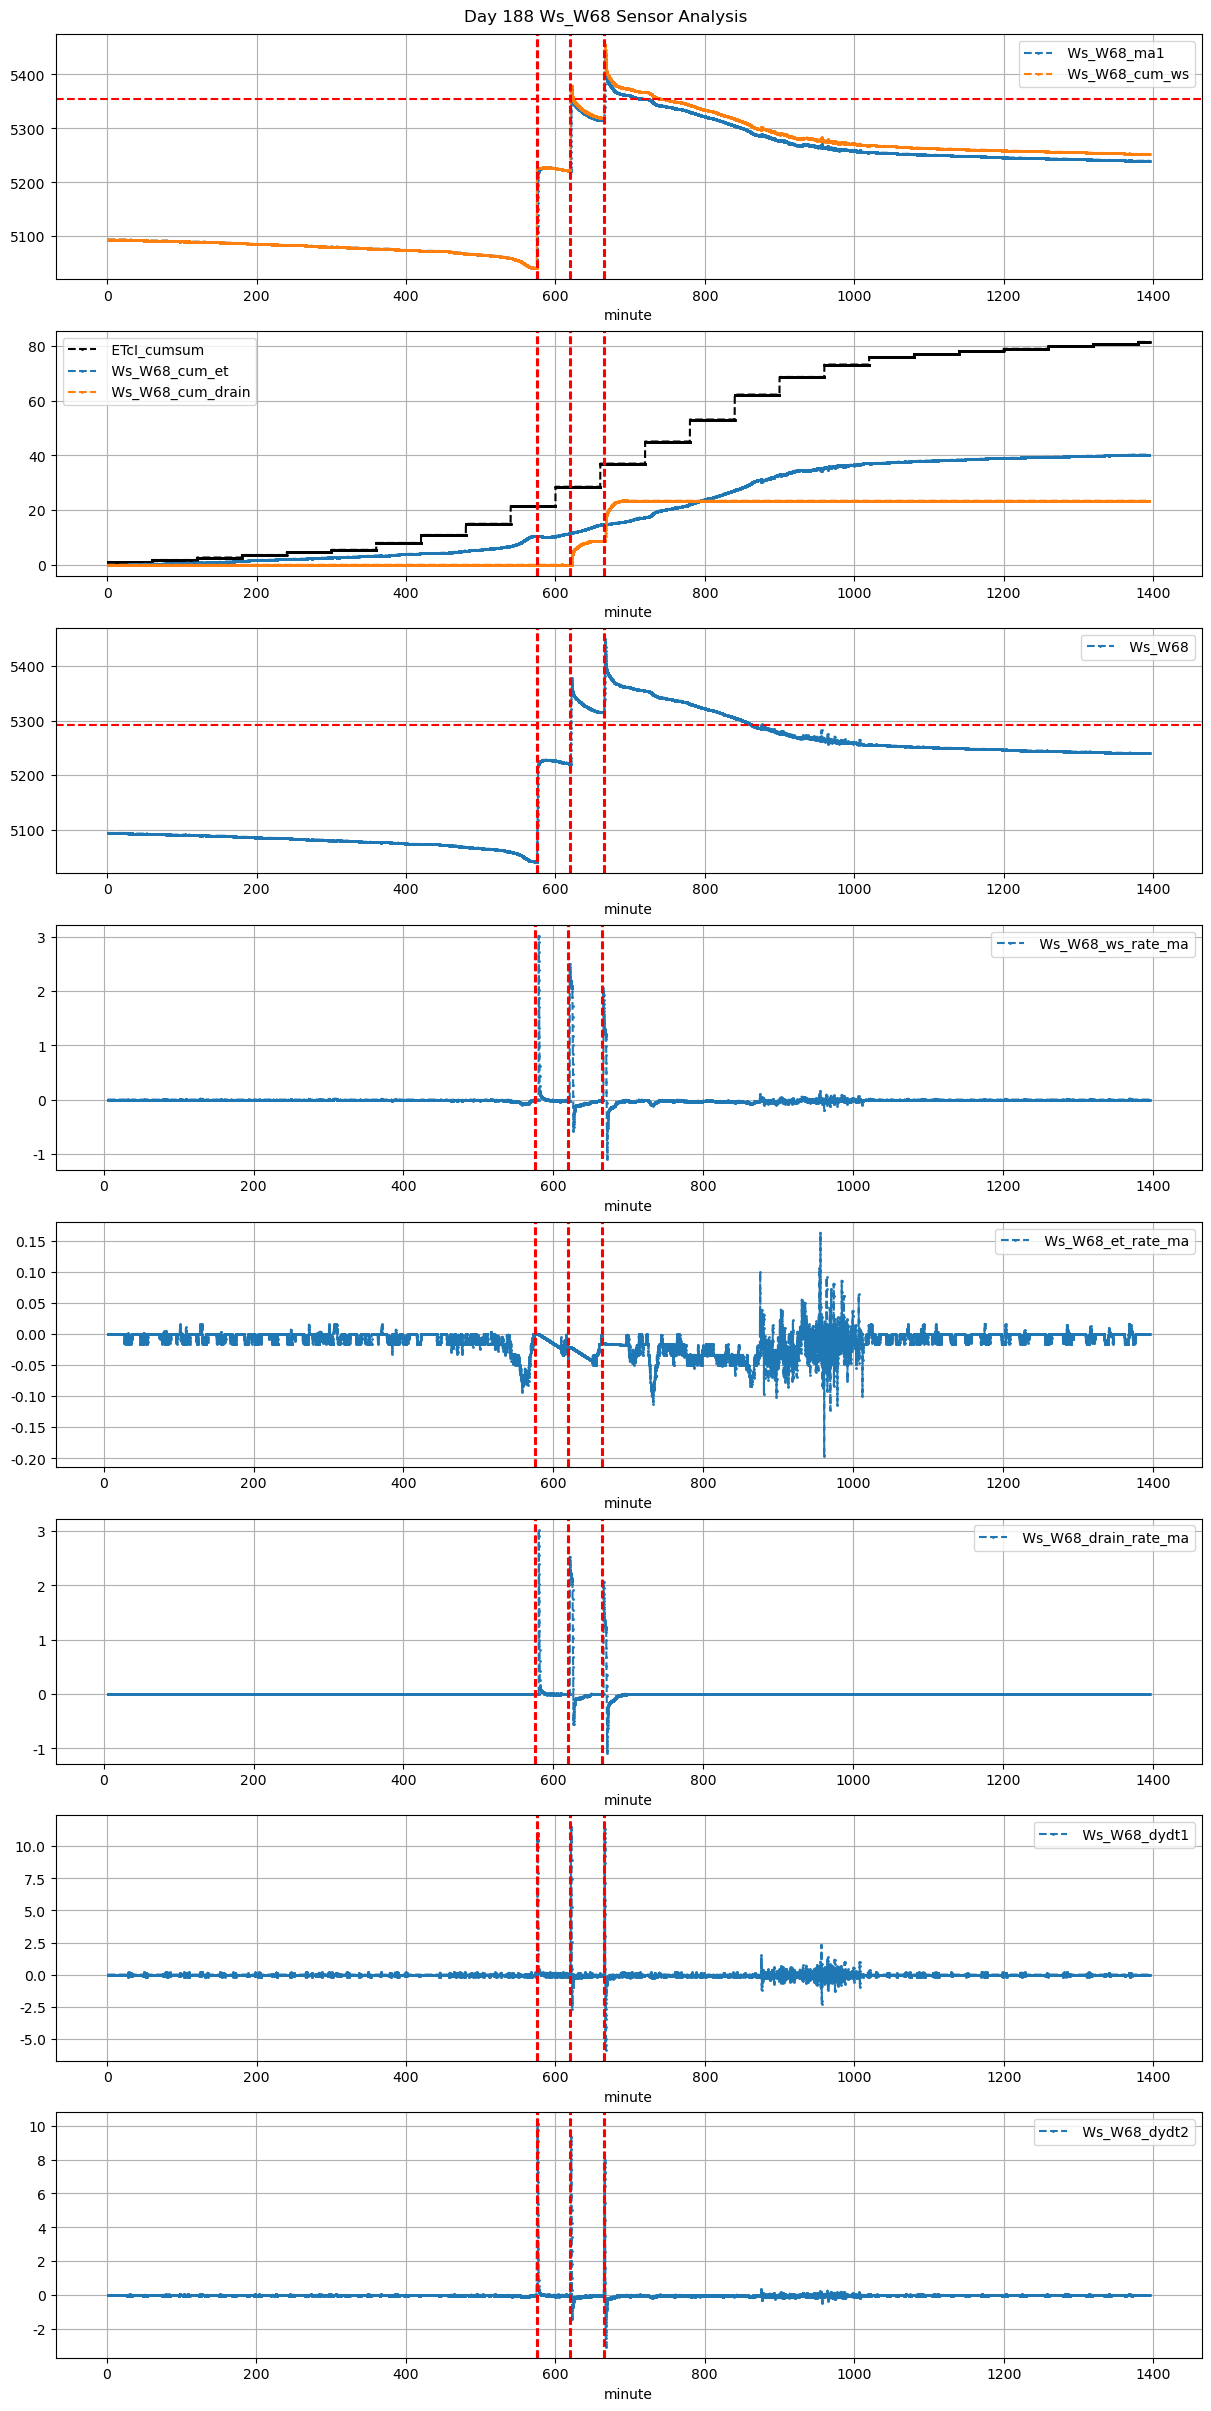
188 |
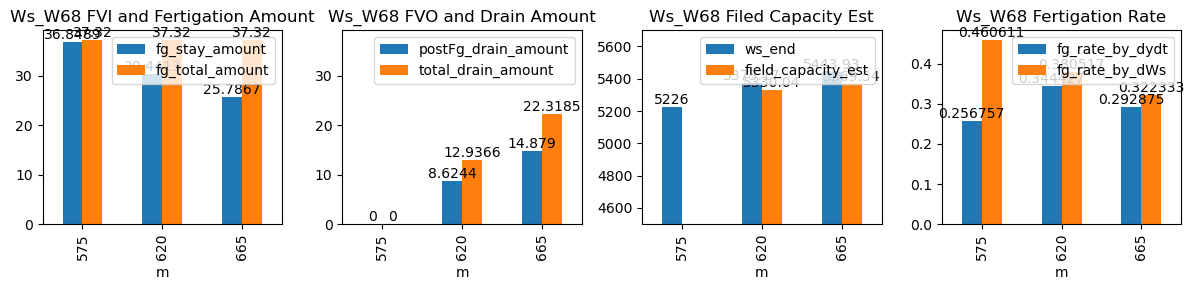
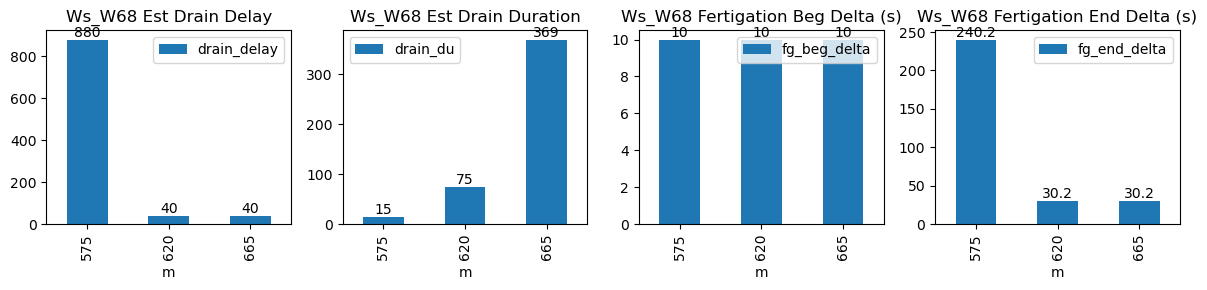
575 |
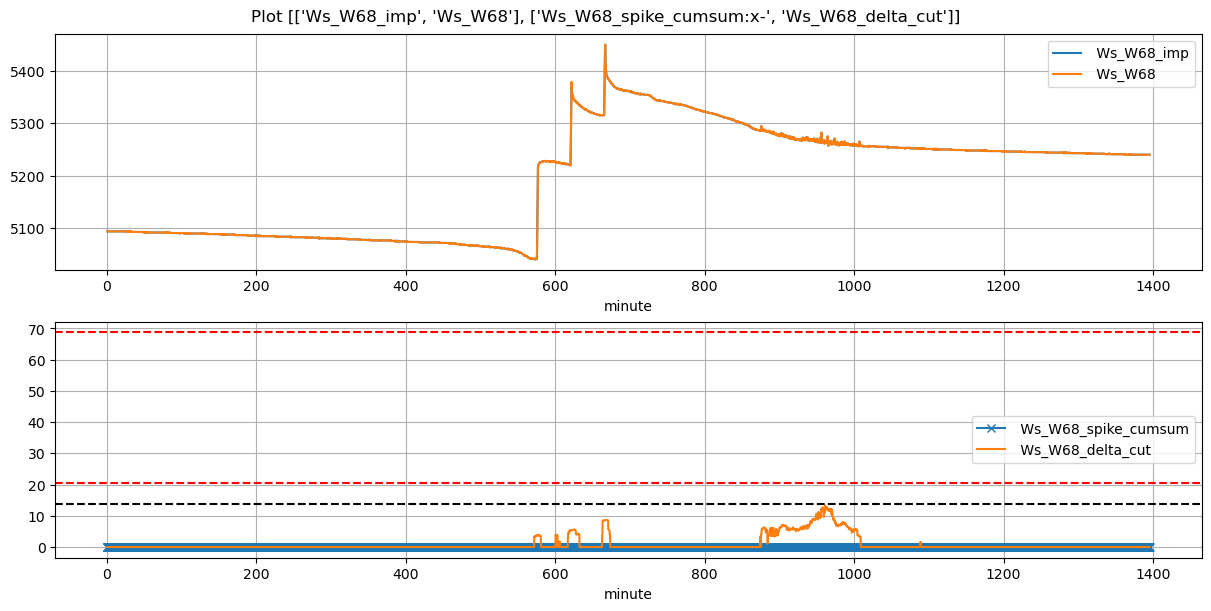
Ws_W68 |
0.41629 |
30 |
575.0 |
575.166667 |
576.33 |
580.333333 |
5041.533333 |
5226.0 |
80 |
-0.010938 |
0.000000 |
-0.022963 |
0.264056 |
0.461167 |
36.893333 |
True |
10.0 |
240.2 |
37.32 |
0.000000 |
0.000000 |
0.000000 |
15 |
880 |
-0.168760 |
NaN |
| 2026-04-12 10:20:00+08:00 |
188 |
620 |
Ws_W68 |
0.41629 |
30 |
620.0 |
620.166667 |
621.33 |
621.833333 |
5220.500000 |
5378.0 |
80 |
-0.020004 |
-0.190560 |
-0.042999 |
0.344427 |
0.393750 |
31.500000 |
True |
10.0 |
30.2 |
37.32 |
4.296223 |
8.592447 |
12.888670 |
75 |
40 |
-2.147262 |
5335.037766 |
| 2026-04-12 11:05:00+08:00 |
188 |
665 |
Ws_W68 |
0.41629 |
30 |
665.0 |
665.166667 |
666.33 |
666.833333 |
5315.000000 |
5449.5 |
80 |
-0.014901 |
-0.293093 |
-0.017311 |
0.290625 |
0.336250 |
26.900000 |
True |
10.0 |
30.2 |
37.32 |
7.478716 |
14.957431 |
22.436147 |
369 |
40 |
-4.402401 |
5374.712843 |