| 2026-04-13 08:30:00+08:00 |
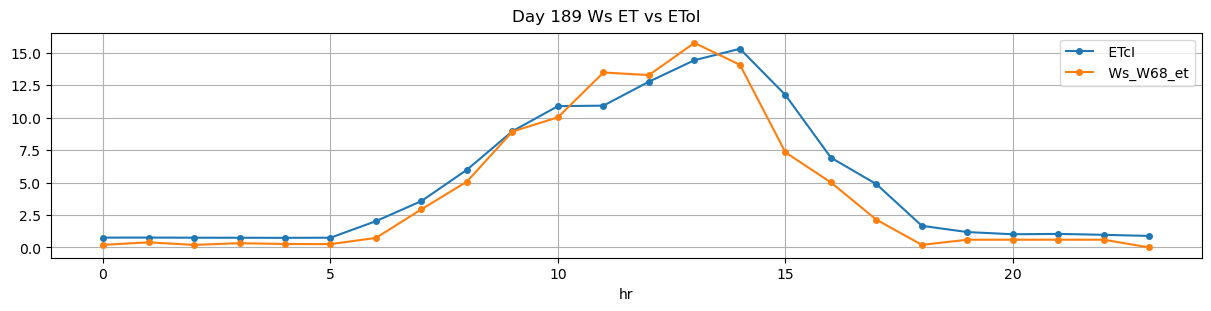
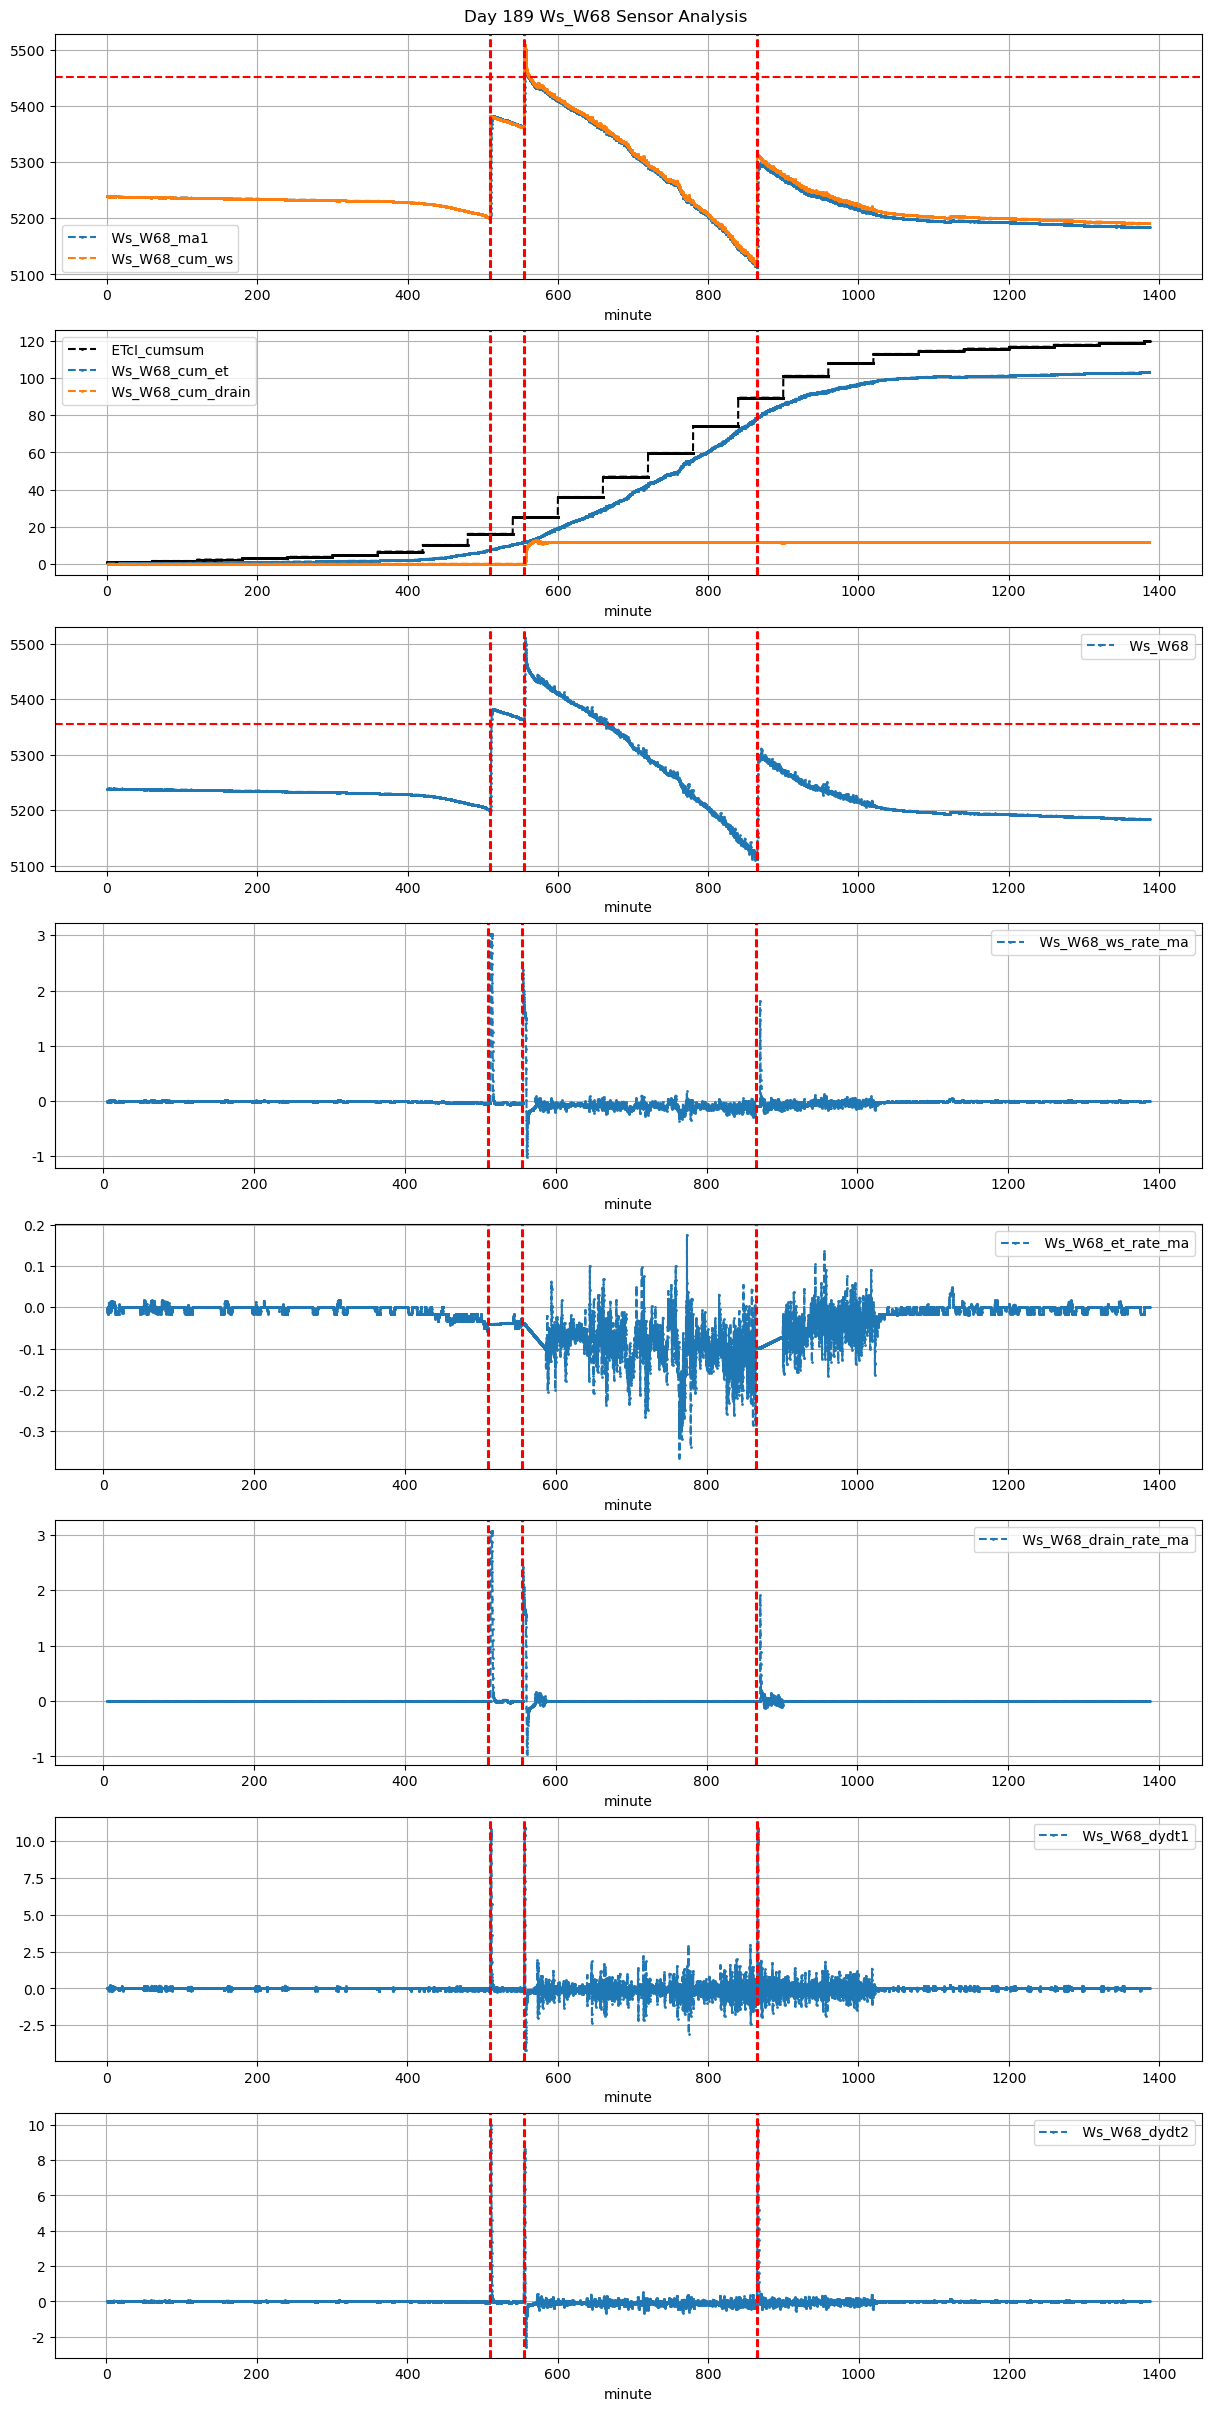
189 |
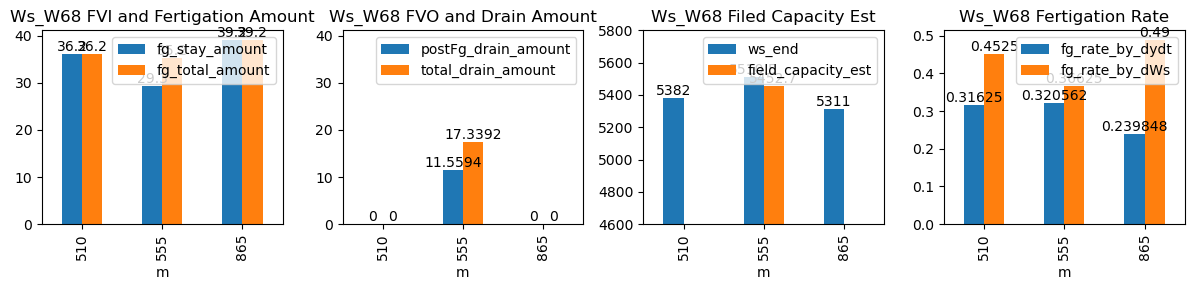
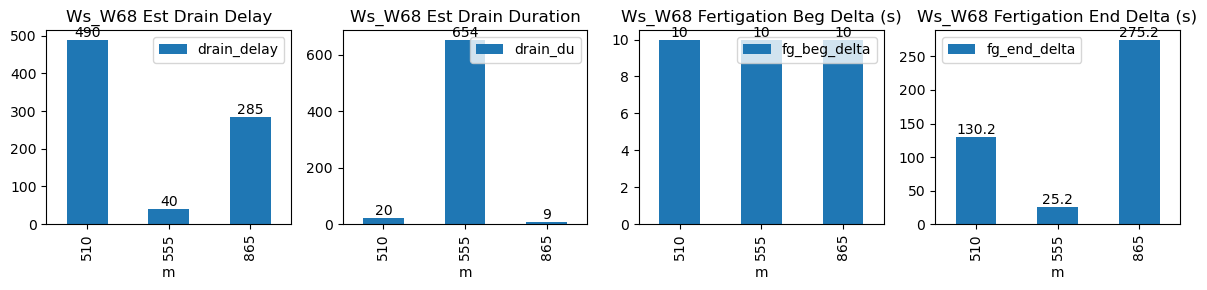
510 |
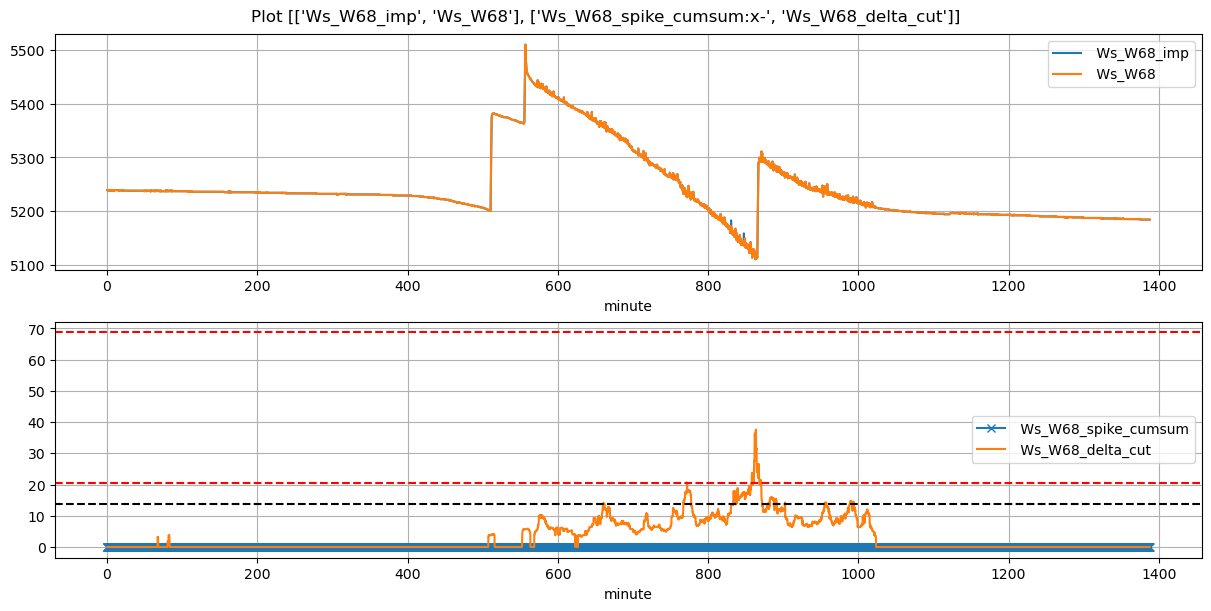
Ws_W68 |
0.466579 |
30 |
510.0 |
510.166667 |
511.33 |
513.500000 |
5201.0 |
5382.0 |
80 |
-0.049700 |
-0.040972 |
-0.036806 |
0.316250 |
0.45250 |
36.2 |
True |
10.0 |
130.2 |
36.2 |
0.000000 |
0.000000 |
0.000000 |
20 |
490 |
-0.165859 |
NaN |
| 2026-04-13 09:15:00+08:00 |
189 |
555 |
Ws_W68 |
0.466579 |
30 |
555.0 |
555.166667 |
556.33 |
556.750000 |
5364.0 |
5510.5 |
80 |
-0.036794 |
-0.320861 |
-0.101181 |
0.320562 |
0.36625 |
29.3 |
True |
10.0 |
25.2 |
35.2 |
5.779719 |
11.559438 |
17.339157 |
654 |
40 |
-3.504910 |
5452.702812 |
| 2026-04-13 14:25:00+08:00 |
189 |
865 |
Ws_W68 |
0.466579 |
30 |
865.0 |
865.166667 |
866.33 |
870.916667 |
5115.0 |
5311.0 |
80 |
-0.130909 |
-0.097338 |
-0.070463 |
0.239848 |
0.49000 |
39.2 |
True |
10.0 |
275.2 |
39.2 |
0.000000 |
0.000000 |
0.000000 |
9 |
285 |
-1.749132 |
NaN |