| 2026-04-14 08:50:00+08:00 |
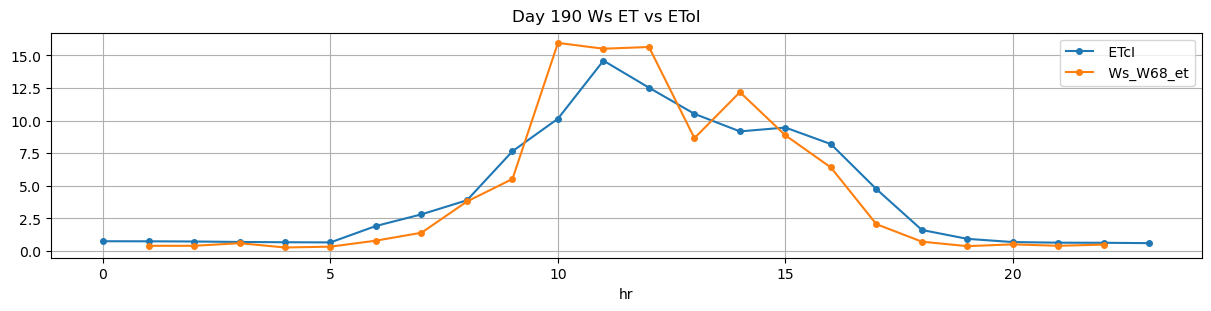
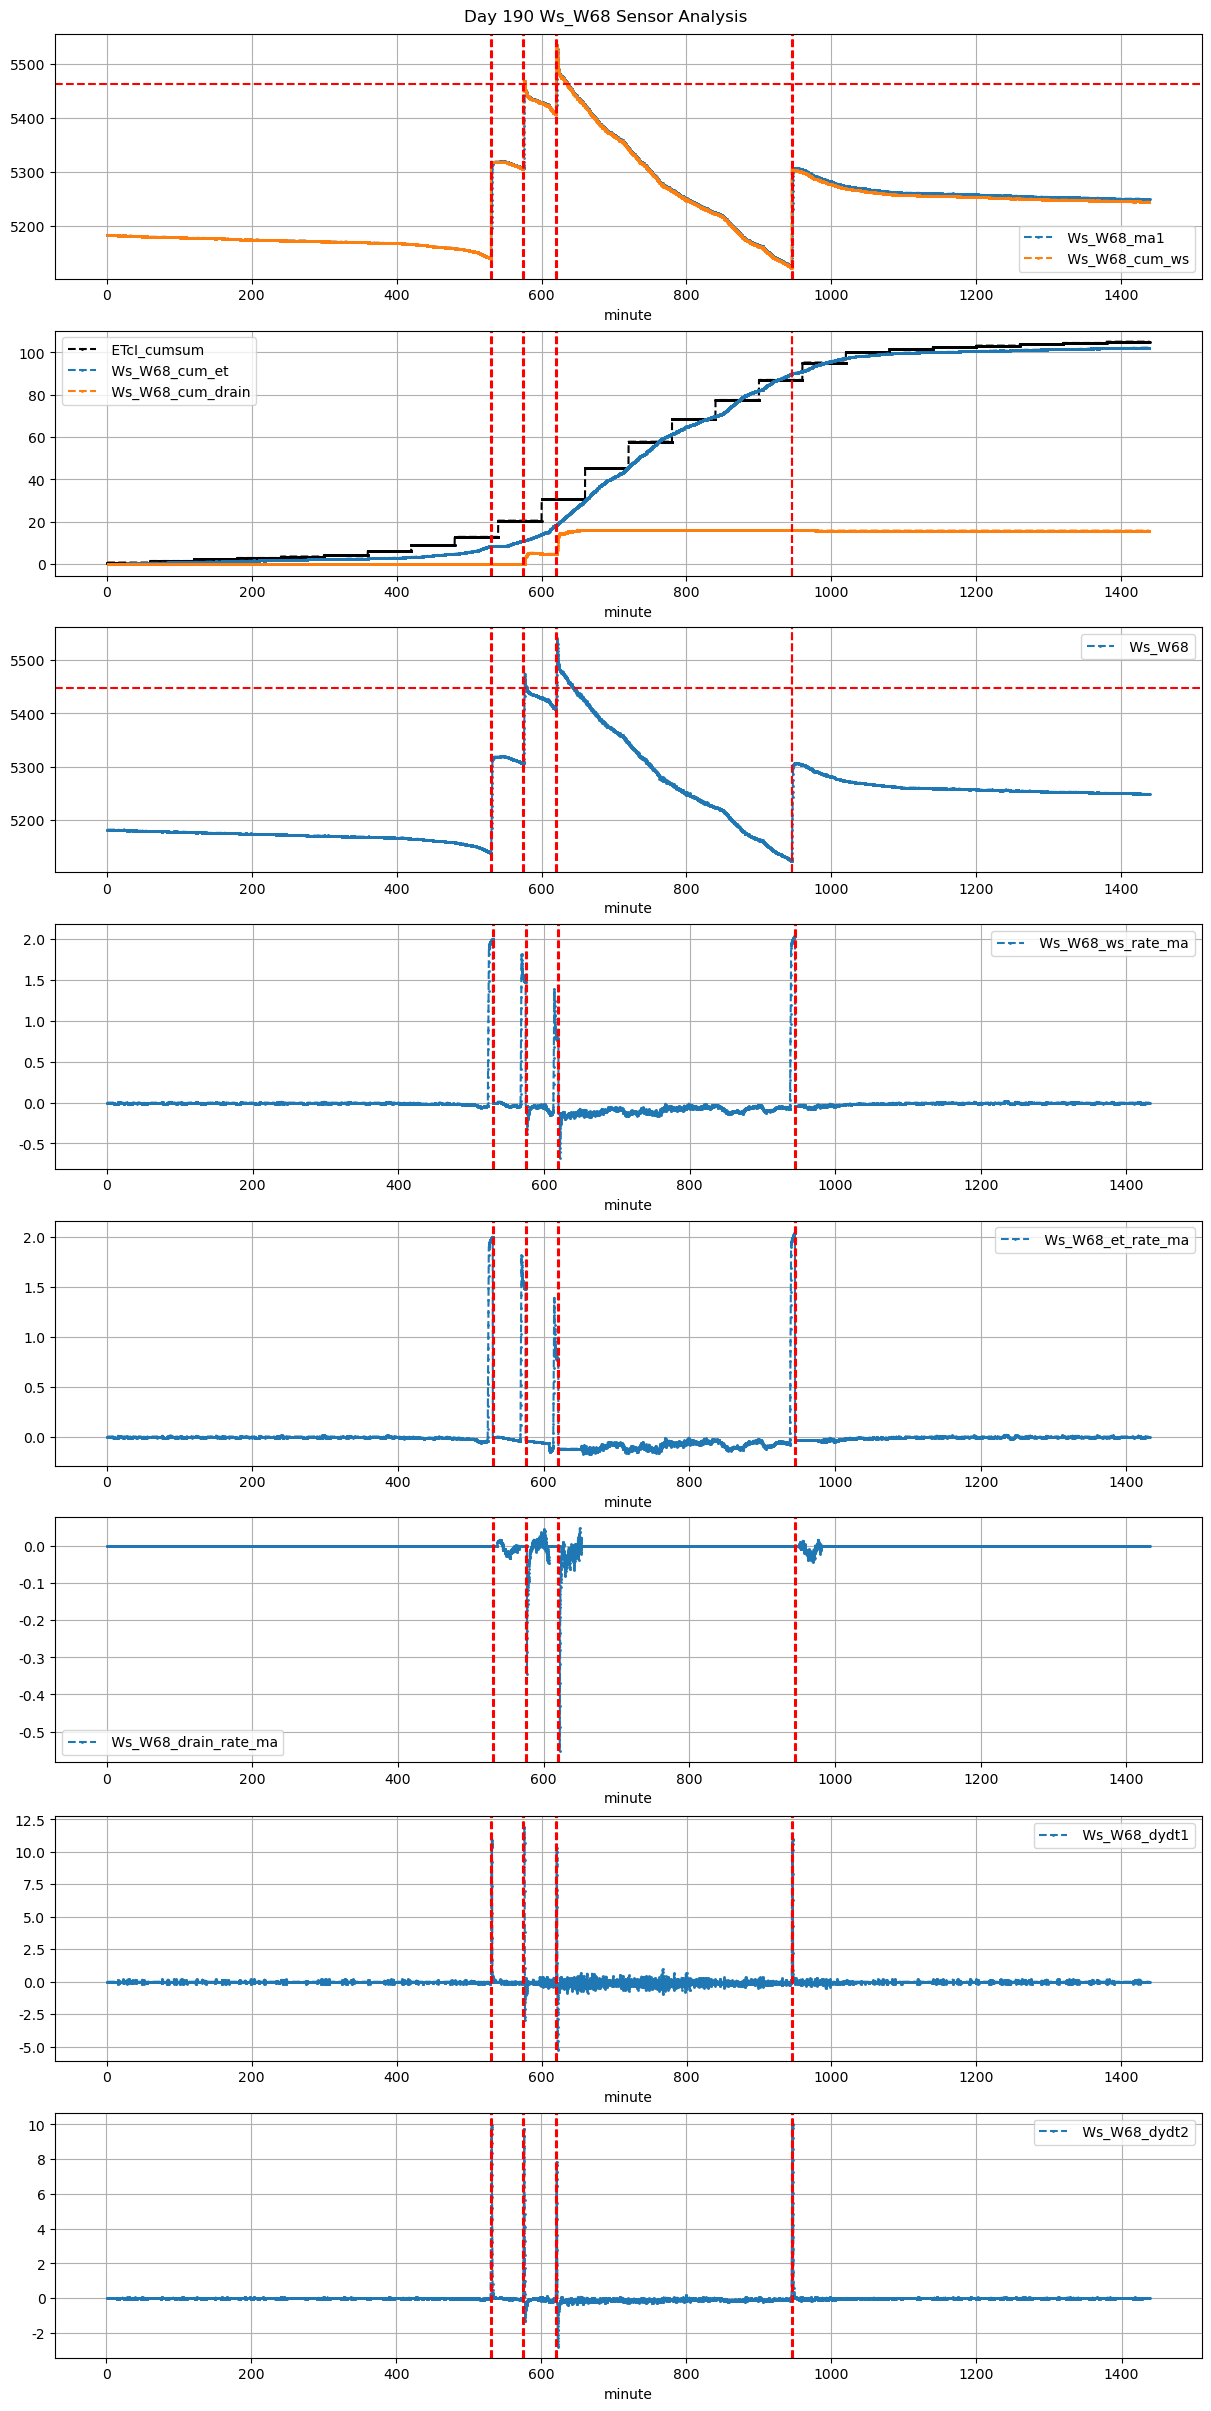
190 |
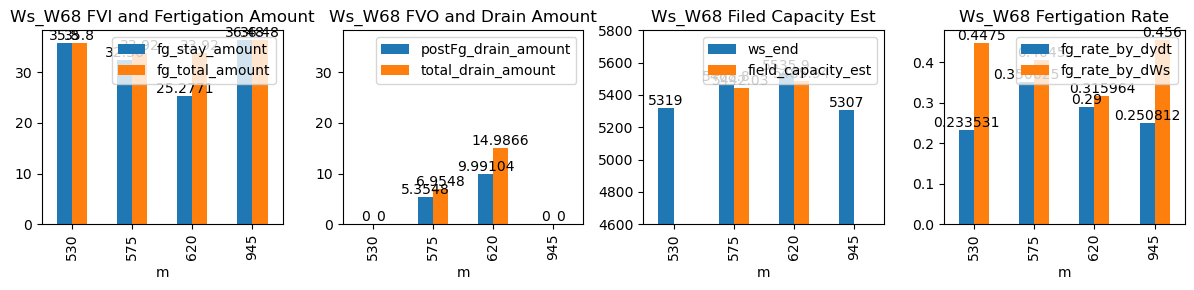
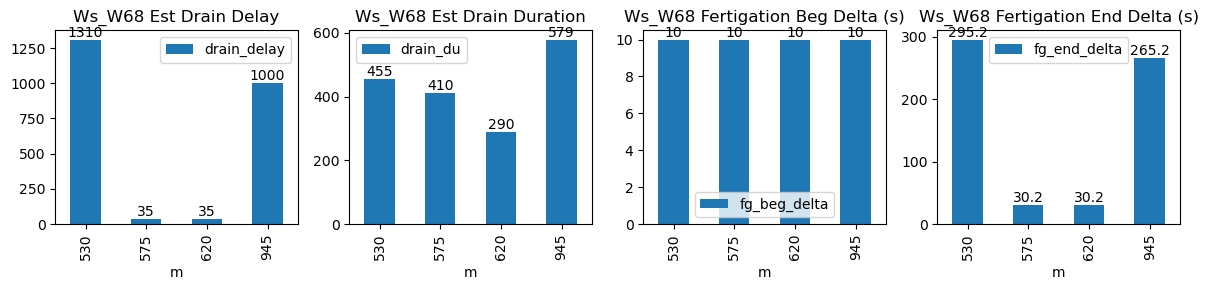
530 |
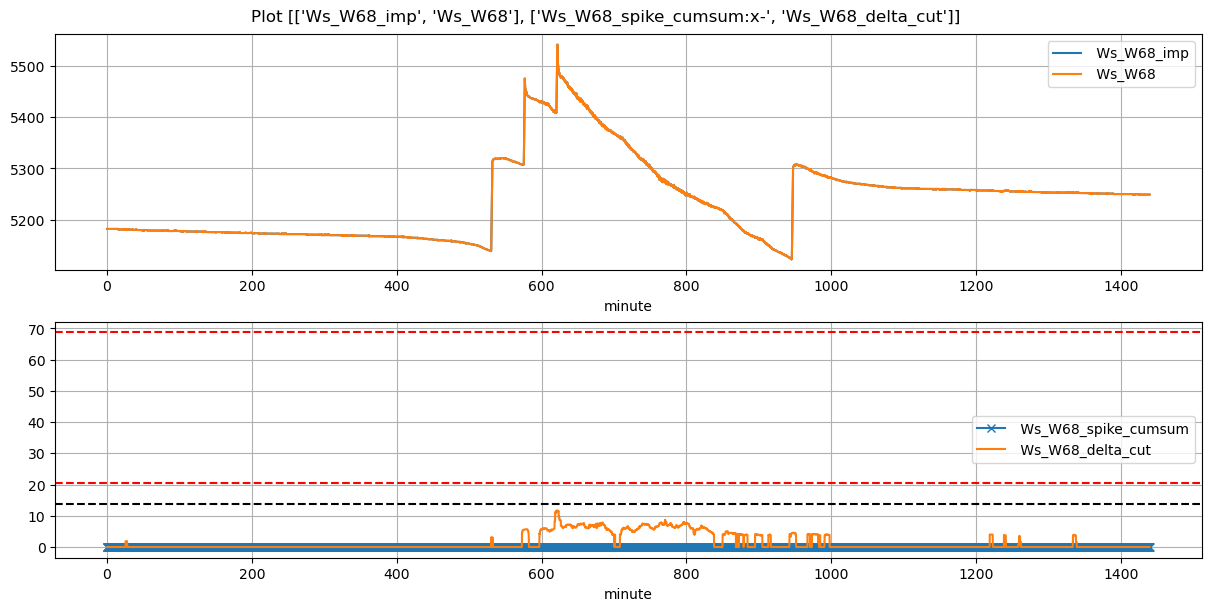
Ws_W68 |
0.421784 |
30 |
530.0 |
530.166667 |
531.33 |
536.250000 |
5140.000000 |
5319.0 |
80 |
-0.048065 |
0.000000 |
-0.041420 |
0.233531 |
0.447500 |
35.800000 |
True |
10.0 |
295.2 |
35.80 |
0.000000 |
0.000000 |
0.000000 |
455 |
1310 |
-0.030963 |
NaN |
| 2026-04-14 09:35:00+08:00 |
190 |
575 |
Ws_W68 |
0.421784 |
30 |
575.0 |
575.166667 |
576.33 |
576.833333 |
5307.000000 |
5468.8 |
80 |
-0.042441 |
-0.105074 |
-0.067510 |
0.350625 |
0.404500 |
32.360000 |
True |
10.0 |
30.2 |
33.92 |
1.600000 |
5.354798 |
6.954798 |
410 |
35 |
-0.165053 |
5442.026011 |
| 2026-04-14 10:20:00+08:00 |
190 |
620 |
Ws_W68 |
0.421784 |
30 |
620.0 |
620.166667 |
621.33 |
621.833333 |
5409.514286 |
5535.9 |
80 |
-0.122160 |
-0.197922 |
-0.122984 |
0.290000 |
0.315964 |
25.277143 |
True |
10.0 |
30.2 |
33.92 |
4.995518 |
9.991035 |
14.986553 |
290 |
35 |
-0.088914 |
5485.944823 |
| 2026-04-14 15:45:00+08:00 |
190 |
945 |
Ws_W68 |
0.421784 |
30 |
945.0 |
945.166667 |
946.33 |
950.750000 |
5124.600000 |
5307.0 |
80 |
-0.065364 |
-0.037027 |
-0.040417 |
0.250812 |
0.456000 |
36.480000 |
True |
10.0 |
265.2 |
36.48 |
0.000000 |
0.000000 |
0.000000 |
579 |
1000 |
-0.036330 |
NaN |