| 2025-12-06 08:05:00+08:00 |
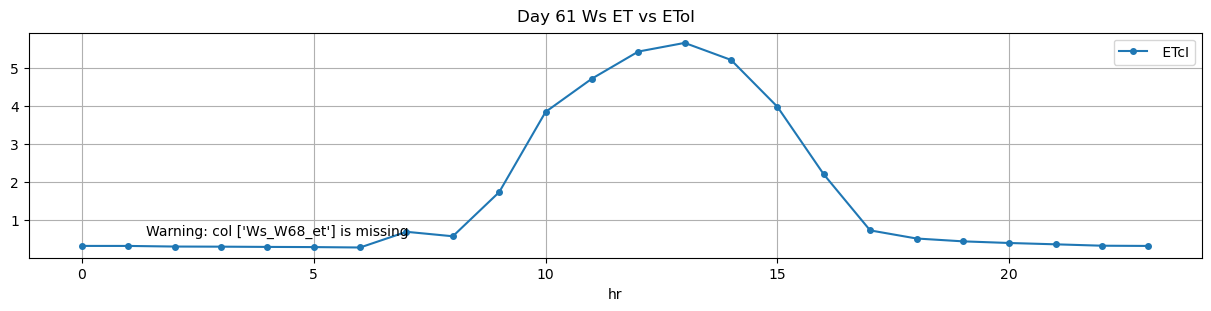
61 |
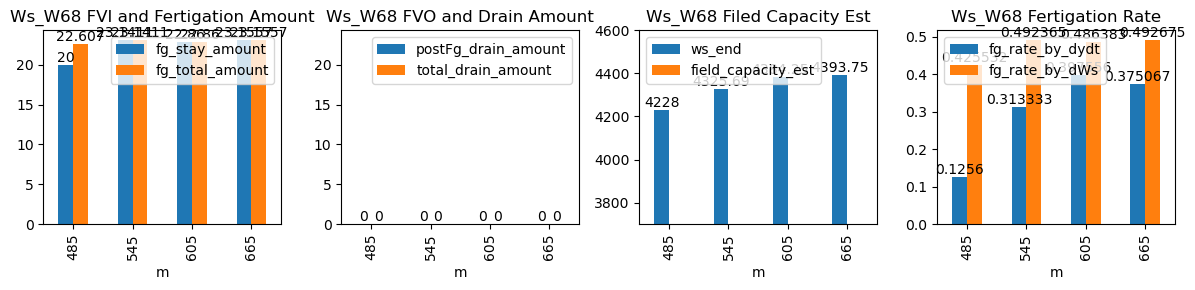
485 |
Ws_W68 |
0.387695 |
30 |
485.0 |
485.25 |
485.78 |
490.583333 |
4128.000000 |
4228.0000 |
47 |
NaN |
0.000000 |
-0.036591 |
0.125600 |
0.425532 |
20.000000 |
True |
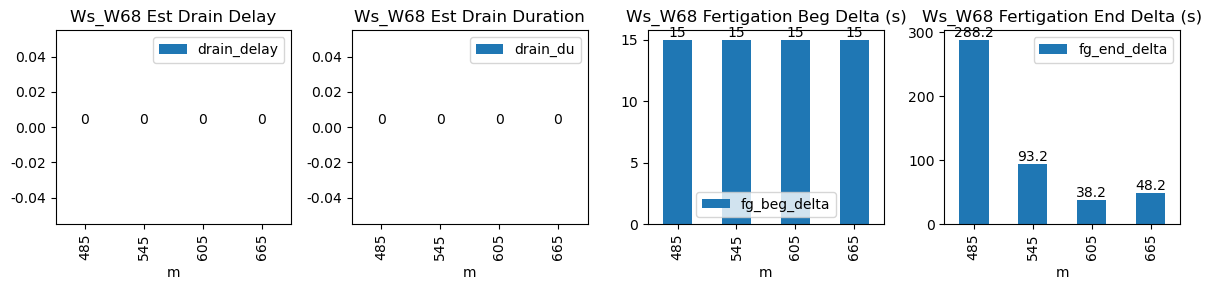
15.0 |
288.2 |
22.607000 |
0.0 |
0 |
0.0 |
NaN |
NaN |
NaN |
NaN |
| 2025-12-06 09:05:00+08:00 |
61 |
545 |
Ws_W68 |
0.387695 |
30 |
545.0 |
545.25 |
545.78 |
547.333333 |
4209.981818 |
4325.6875 |
47 |
NaN |
-0.077008 |
-0.073519 |
0.313333 |
0.492365 |
23.141136 |
True |
15.0 |
93.2 |
23.141136 |
0.0 |
0 |
0.0 |
NaN |
NaN |
NaN |
NaN |
| 2025-12-06 10:05:00+08:00 |
61 |
605 |
Ws_W68 |
0.387695 |
30 |
605.0 |
605.25 |
605.78 |
606.416667 |
4269.950000 |
4384.2500 |
47 |
NaN |
-0.185780 |
-0.108198 |
0.397556 |
0.486383 |
22.860000 |
True |
15.0 |
38.2 |
22.860000 |
0.0 |
0 |
0.0 |
NaN |
NaN |
NaN |
NaN |
| 2025-12-06 11:05:00+08:00 |
61 |
665 |
Ws_W68 |
0.387695 |
30 |
665.0 |
665.25 |
665.78 |
666.583333 |
4277.971429 |
4393.7500 |
47 |
NaN |
-0.185154 |
-0.138296 |
0.375067 |
0.492675 |
23.155714 |
True |
15.0 |
48.2 |
23.155714 |
0.0 |
0 |
0.0 |
NaN |
NaN |
NaN |
NaN |