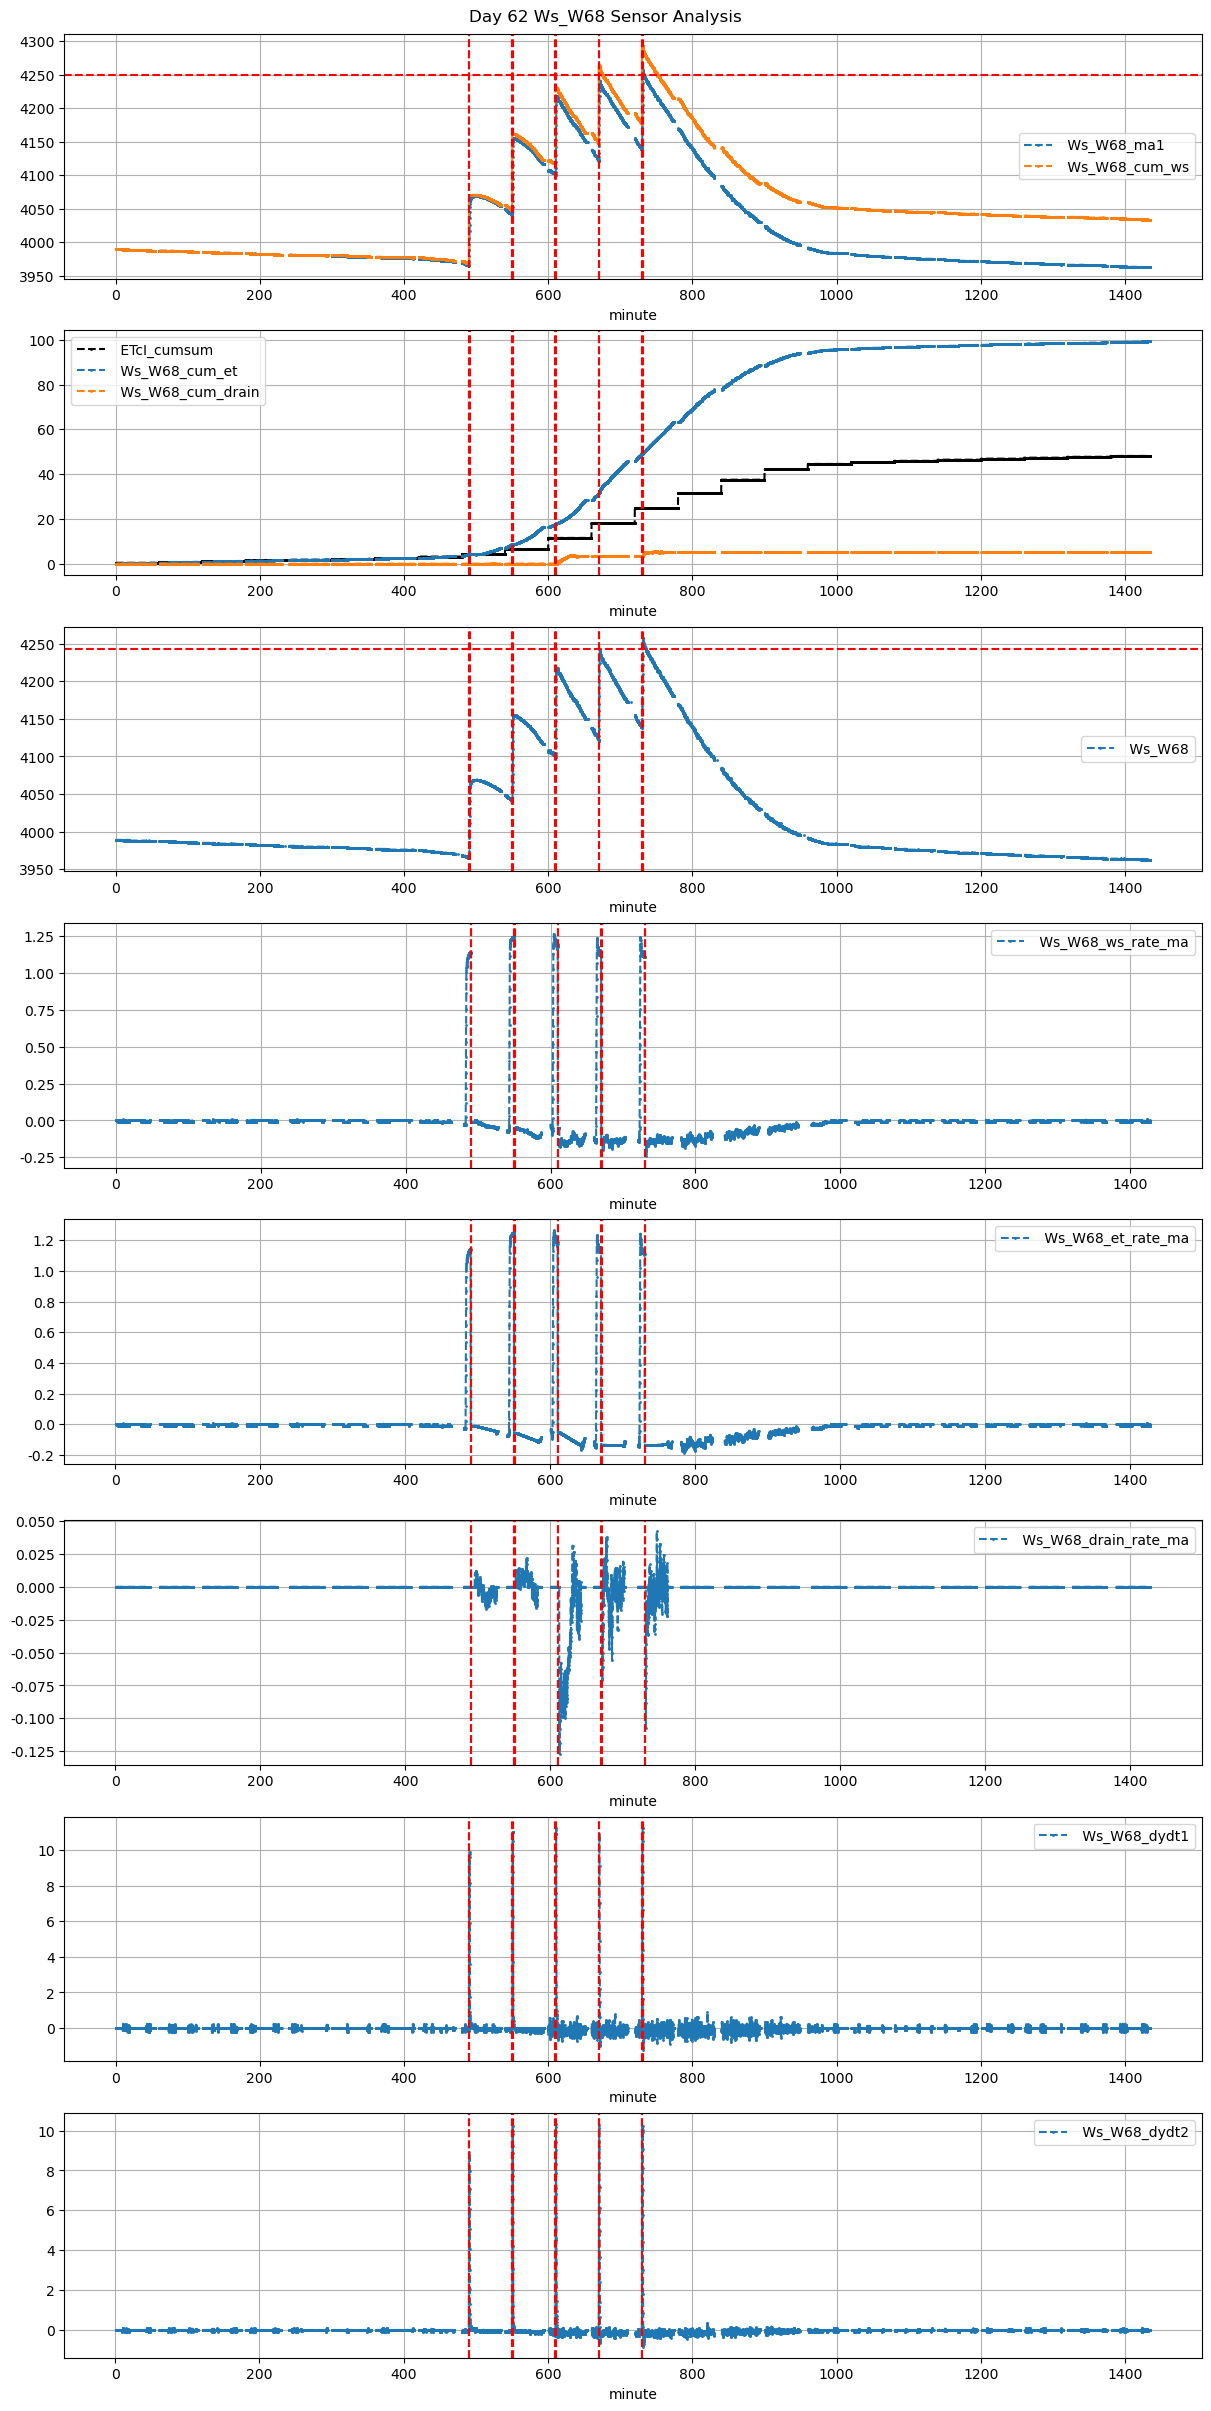
| 2025-12-07 08:10:00+08:00 |
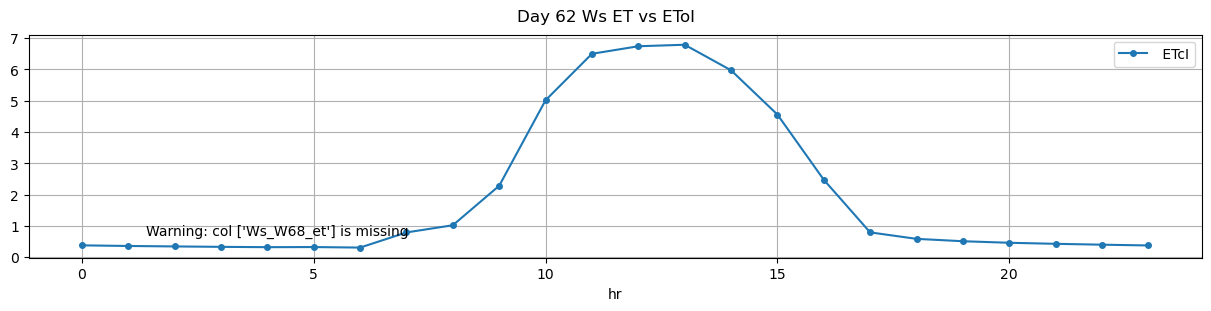
62 |
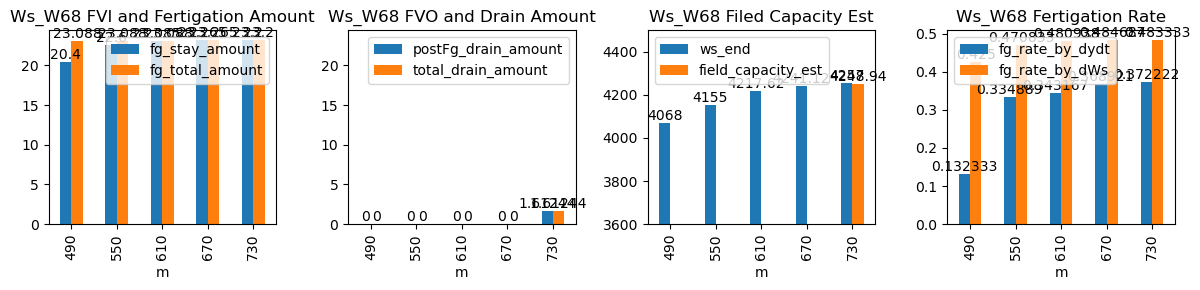
490 |
Ws_W68 |
0.359113 |
30 |
490.0 |
490.333333 |
490.8 |
495.500000 |
3966.0 |
4068.000 |
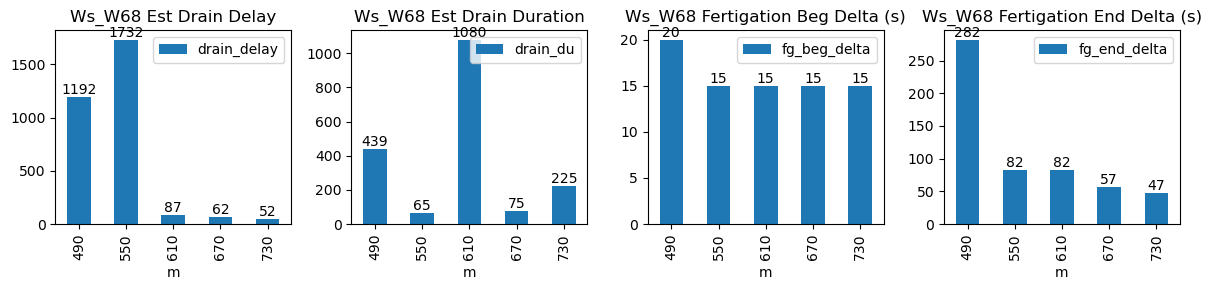
48 |
-0.028448 |
-0.009204 |
-0.045154 |
0.132333 |
0.425000 |
20.400 |
True |
20.0 |
282.0 |
23.088 |
0.0 |
0.000000 |
0.000000 |
439 |
1192 |
-0.014112 |
NaN |
| 2025-12-07 09:10:00+08:00 |
62 |
550 |
Ws_W68 |
0.359113 |
30 |
550.0 |
550.250000 |
550.8 |
552.166667 |
4042.0 |
4155.000 |
48 |
-0.071392 |
-0.055329 |
-0.108951 |
0.334889 |
0.470833 |
22.600 |
True |
15.0 |
82.0 |
23.088 |
0.0 |
0.000000 |
0.000000 |
65 |
1732 |
-0.013853 |
NaN |
| 2025-12-07 10:10:00+08:00 |
62 |
610 |
Ws_W68 |
0.359113 |
30 |
610.0 |
610.250000 |
610.8 |
612.166667 |
4102.2 |
4217.625 |
48 |
-0.052269 |
-0.149688 |
-0.137428 |
0.343167 |
0.480938 |
23.085 |
True |
15.0 |
82.0 |
23.088 |
0.0 |
0.000000 |
0.000000 |
1080 |
87 |
-0.097590 |
NaN |
| 2025-12-07 11:10:00+08:00 |
62 |
670 |
Ws_W68 |
0.359113 |
30 |
670.0 |
670.250000 |
670.8 |
671.750000 |
4124.8 |
4241.125 |
48 |
-0.134312 |
-0.133045 |
-0.138877 |
0.368921 |
0.484687 |
23.265 |
True |
15.0 |
57.0 |
23.265 |
0.0 |
0.000000 |
0.000000 |
75 |
62 |
-0.037752 |
NaN |
| 2025-12-07 12:10:00+08:00 |
62 |
730 |
Ws_W68 |
0.359113 |
30 |
730.0 |
730.250000 |
730.8 |
731.583333 |
4141.0 |
4257.000 |
48 |
-0.136975 |
-0.153117 |
-0.130556 |
0.372222 |
0.483333 |
23.200 |
True |
15.0 |
47.0 |
23.200 |
0.0 |
1.612443 |
1.612443 |
225 |
52 |
-0.035774 |
4248.937783 |